US Dollar Forecast: USD/CAD
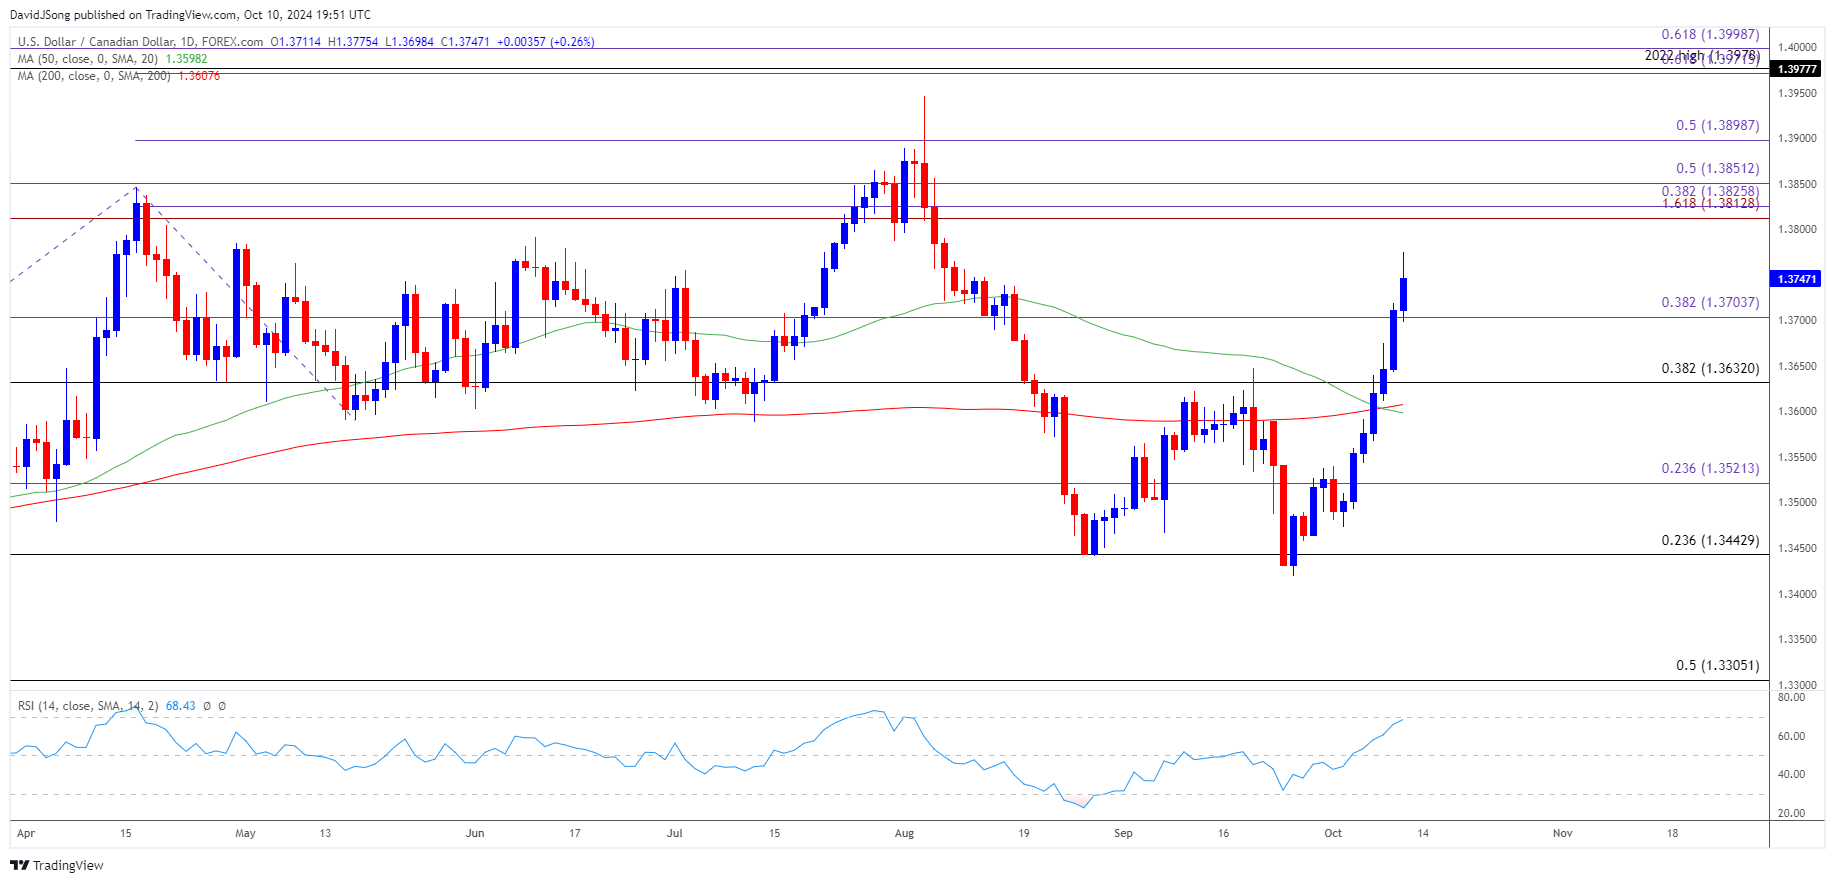
USD/CAD rallies for the seventh consecutive day to push the Relative Strength Index (RSI) up against overbought territory, with a move above 70 in the oscillator likely to be accompanied by a further advance in the exchange rate like the price action from earlier this year.
USD/CAD Rally Pushes RSI Up Against Overbought Zone
USD/CAD cleared the September high (1.3848) after showing a limited response to the negative slope in the 50-Day SMA (1.3598), and the exchange rate may continue to register fresh monthly highs as it extends the series of higher highs and lows carried over from last week.
Join David Song for the Weekly Fundamental Market Outlook webinar. David provides a market overview and takes questions in real-time. Register Here
With that said, USD/CAD may attempt to further retrace the decline from the August high (1.3947) as it marks the longest rally since July, but the Relative Strength Index (RSI) may show the bullish momentum abating if it struggles to push above 70.
USD/CAD Price Chart – Daily

Chart Prepared by David Song, Strategist; USD/CAD Price on TradingView
- USD/CAD continues to carve a series of higher highs and lows to register a fresh monthly high (1.3775), with a break/close above the 1.3810 (161.8% Fibonacci extension) to 1.3850 (50% Fibonacci extension) region raising the scope for a move towards 1.3900 (50% Fibonacci extension).
- A breach above the August high (1.3947) opens up the 2022 high (1.3978) but the bullish price series in USD/CAD may start to unravel if the Relative Strength Index (RSI) fails to mirror the behavior from earlier this year and holds below 70.
- Need a move below 1.3700 (38.2% Fibonacci extension) to bring 1.3630 (38.2% Fibonacci retracement) back on the radar, with the next area of interest coming in around 1.3520 (23.6% Fibonacci extension).
Additional Market Outlooks
Australian Dollar Forecast: AUD/USD Bearish Price Series Persists
USD/JPY Defends Post-NFP Reaction with CPI Report in Focus
NZD/USD on Cusp of Testing September Low Ahead of RBNZ Rate Decision
GBP/USD Vulnerable on Close Below 50-Day SMA
--- Written by David Song, Senior Strategist
Follow on Twitter at @DavidJSong


