US Dollar Talking Points:
- Last week brought the Jackson Hole Economic Symposium and FOMC Chair Jerome Powell struck a balanced tone. But the reaction in USD was strength with a really strong showing on Thursday.
- For this week the economic calendar shifts the focus back to data as tomorrow brings consumer confidence numbers which are followed by Thursday’s release of Core PCE data and Friday’s release of Non-farm Payrolls. The possibility of another hike before the end of the year is currently above 55%, and the PCE data on Thursday will be a big push point of this theme as this is the Fed’s preferred inflation gauge.
- I’ll be discussing these themes in-depth in the weekly webinar on Tuesday at 1PM ET. It’s free for all to register: Click here to register.
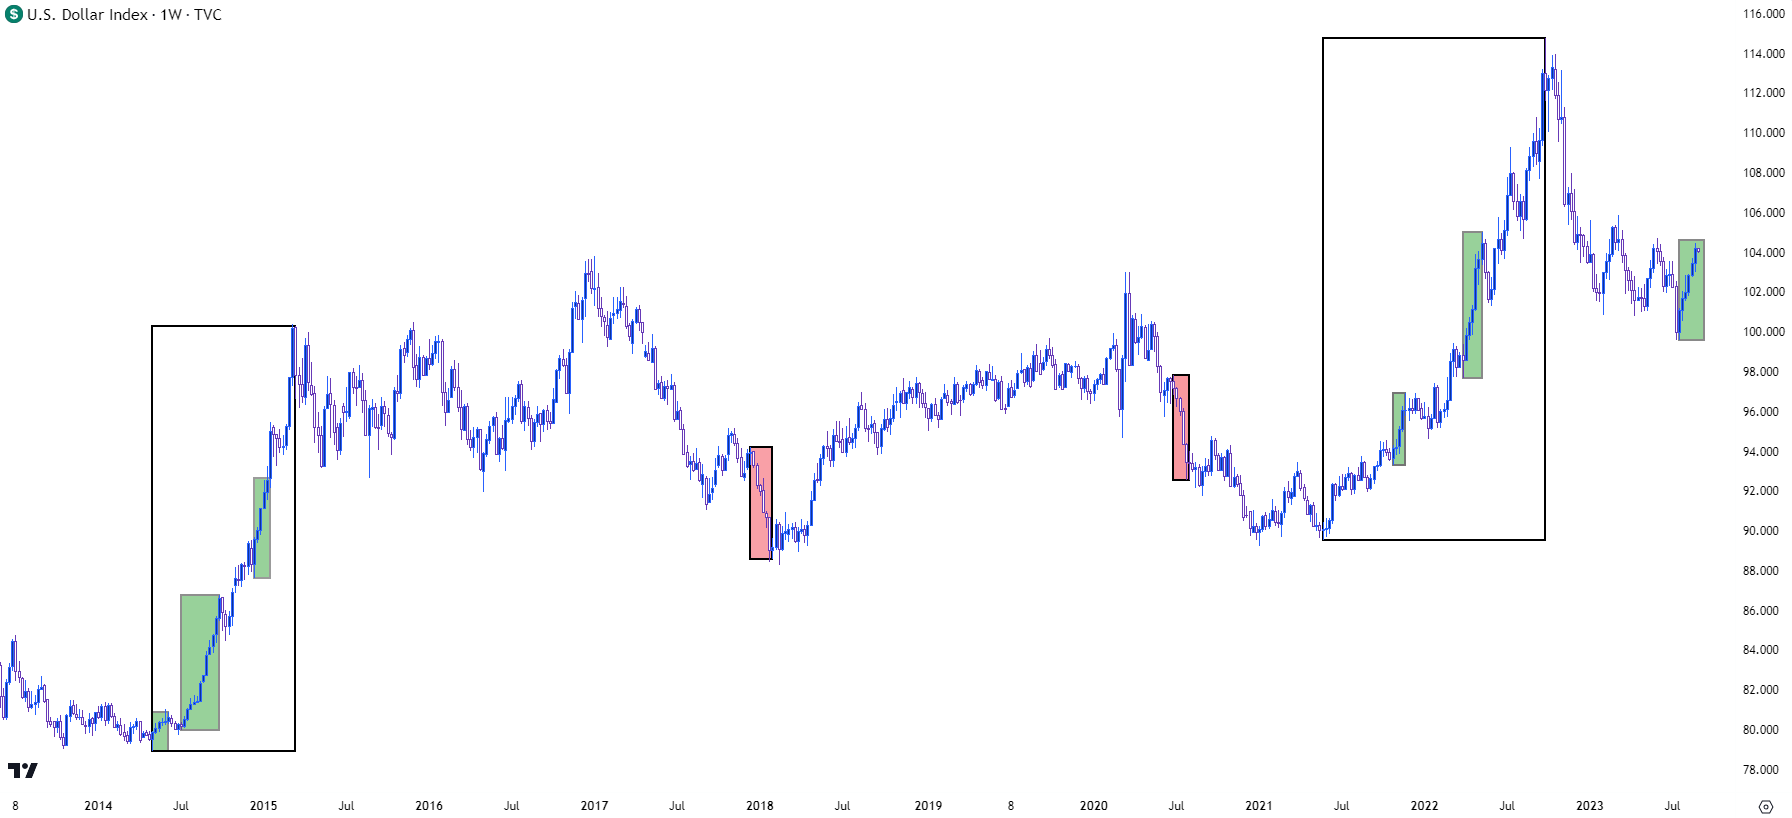
The US Dollar just completed its sixth consecutive weekly gain via DXY. This isn’t a very common occurrence, as there’s only been six such episodes over the past decade. But, perhaps more importantly, such a streak of strength doesn’t just develop on its own, so the bigger question is what else is going on behind that and perhaps more importantly, whether it might continue and what this might be telling us.
Of the five instances that took place before last week, two had occurred in 2022 when the US Dollar bullish theme was building as the Fed ramped up rate hikes; and three took place in the summer of 2014 and early 2015, around the time that the Euro was being punished on the back of sovereign debt woes that had plagued the continent.
By comparison, there’ve only been two instances of six consecutive down weeks in the DXY and similarly, both of those showed during rather extreme trending periods. The most recent was the summer of 2020 after the unprecedented monetary response from the Fed, with the other taking place in early-2018.
Each of those instances of six consecutive weeks of gains (or losses) are marked on the below weekly chart, and each constitutes exactly six periods, except for the second instance which ran for 12 weeks.
US Dollar - DXY Weekly Price Chart (indicative only, not available on Forex.com platforms)
 Chart prepared by James Stanley; data derived from Tradingview
USD Intermediate-Term
Given that something that rarely happens just happened with the US Dollar, the next natural question is whether there’s additional support for that argument and from the intermediate-term look, it appears that there could be.
The streaks of consecutive weekly gains or losses have shown during times of strong trends (either up or down) and so far in 2023, the US Dollar has been consolidating for most of the year. A big part of this, of course, is the Euro and EUR/USD, which has similarly been consolidating, and at the source of each is monetary policy from the Federal Reserve and the European Central Bank. As rate hike expectations continue to look for the possibility of more tightening out of the US on the back of persistent inflation, that expectation has been waning in Europe of late as European economic data has started to underperform.
This is what’s changed of late, after EUR/USD hit a high of 1.1275 last month before reversing and the bearish theme that came from that is now six weeks old.
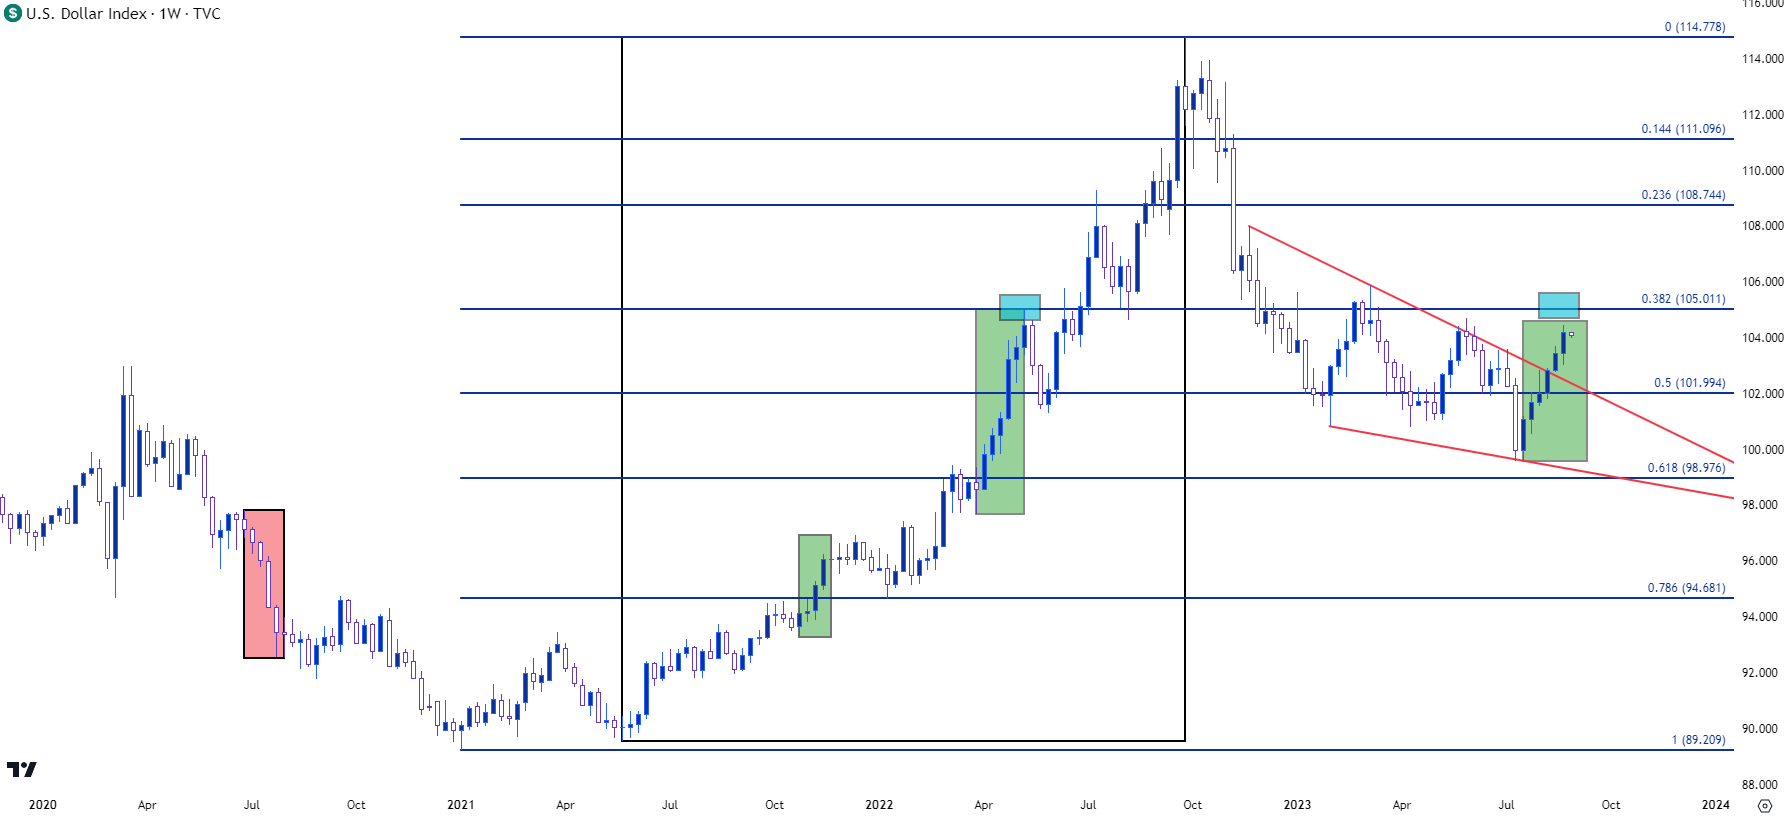
In the US Dollar, this spate of strength came right after a failed breakdown in July (which meshes with the EUR/USD resistance inflection at 1.1275) and that’s led into a bullish break of a falling wedge pattern. Falling wedges are often approached with the aim of bullish reversal and given that the pattern built after the Q4 drawdown in the Greenback, this would illustrate more than seven months of consolidation before the reversal took place.
As an interesting point – the prior six-week streak that finished in May of 2022 topped out at the 105.00 handle, which has since become the 38.2% Fibonacci retracement of that bullish trend. This would offer a bit of confluence for that next significant spot of resistance for the US Dollar.
US Dollar - DXY Weekly Price Chart (indicative only, not available on Forex.com platforms)
 Chart prepared by James Stanley; data derived from Tradingview
US Dollar Short-Term
US Dollar bulls continue to go to work at support. It’s been a building story over the past month and last week produced yet another strong push from bulls after the Wednesday daily bar closed as a bearish pin bar. At the source of that pullback was below-expectation PMI prints that were released that morning, helping to bring the USD off of what was a fresh two month high at the time.
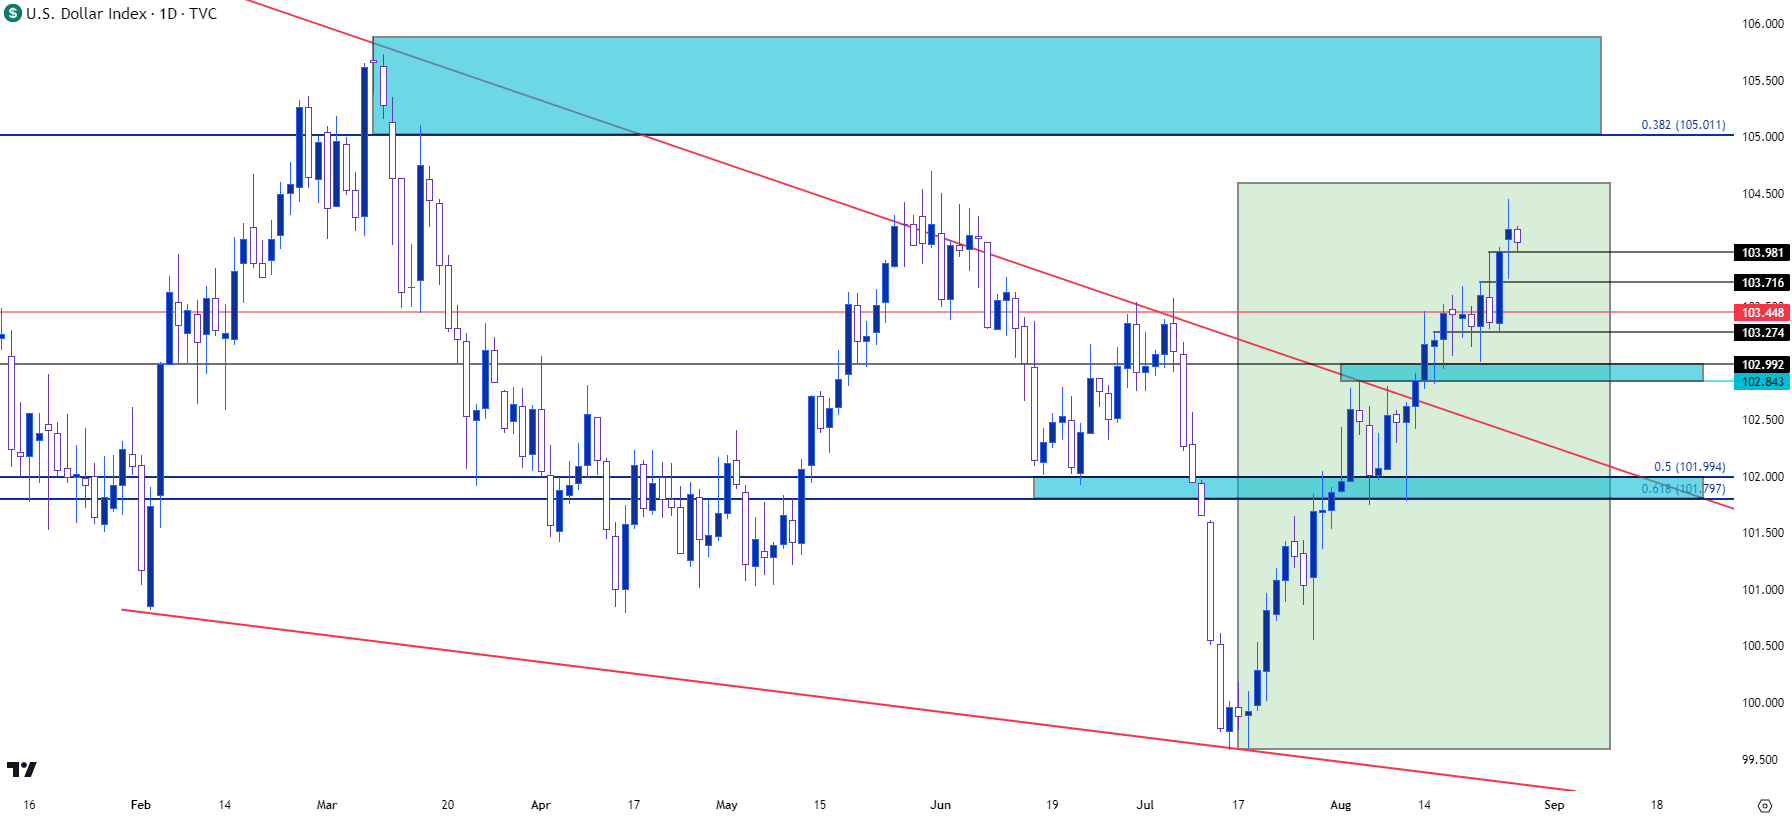
But as we’ve already seen a couple of times over the past month, USD bulls came in at support, this time at 103.27, and they held the low into Thursday trade at which point a strong bullish move developed as EUR/USD pushed below a key spot of support at 1.0845. That strength extended into Friday trade, with DXY eventually tagging resistance at 104.31 and that’s so far stalled the advance. But as we’ve seen since the USD set its current low in mid-July, the big response from bulls has so far come at support tests, so the question is where this might take place next.
There’s a prior resistance swing that’s already in-play as support for today and that’s at 103.98. Below that is another prior resistance swing at 103.72, and then below that, we have the familiar spot of 103.45.
Any of those three would constitute a higher-low above the 103.27 spot that held the lows late last week, and this would keep the door open for bullish trend continuation in the Greenback. If those supports get broken, then longer-term support would come back into the picture and the 102.85-103.00 zone would be the closes, with the 101.80-102.00 zone below that.
On the resistance side of the coin, it doesn’t seem as though we’ve seen any profuse topside breakouts yet and this is something that can add some interest to that bullish theme in the DXY as the most noticeable impact from bulls thus far has come at support. The likely explanation behind this is EUR/USD support stalling the downside move there, which has brought an inverse type of response thus far in the US Dollar. But if we do get some continued bad data out of Europe, combined with persistent signs of inflation out of the US, bulls may be remain restrained for much longer.
US Dollar - DXY Daily Price Chart (indicative only, not available on Forex.com platforms)

Chart prepared by James Stanley; data derived from Tradingview
--- written by James Stanley, Senior Strategist


