
US Dollar, Rates, SPX Talking Points:
- While consolidation was the name of the game in the first half of the year, volatility has awoken in a big way in Q3, setting the stage for an eventful finish to the year in Q4.
- The US Dollar is currently working on its 11th consecutive weekly gain, which would be the longest such streak in a decade. USD and 10-year yields have erased the entirety of the pullback that started in March, but the S&P 500 is still more than 8% away from its March low, begging the question as to whether there’s re-pricing that has yet to be seen in stocks.
- I’ll be discussing these themes in-depth in the weekly webinar on Tuesday at 1PM ET. It’s free for all to register: Click here to register.
It was a year ago when the US Dollar had topped and the S&P 500 carved out a bottom. At the time, it seemed low probability as US inflation remained brisk and the trends that were aggressively in-place in the first nine months of the year started to soften around the Q4 open.
EUR/USD played a large role here and for that we can draw back to the European Central Bank, who had remained skittish for much of last year regarding inflation and rate hikes for fear of hitting growth in the economy. But the ECB finally started to ramp up hikes last September, and that continued through the 2023 open and that helped to recover a large portion of that prior sell-off.
But as we traded through the first half of the year both the ECB and the Fed retained a degree of hawkishness as inflation wasn’t yet subdued, and the question remained for how long the central banks might need to continue hiking rates. The third quarter of 2023 is when we began to see some shift in this theme as inflation remains somewhat stubborn in the US and from some vantage points has even started to move higher again. Europe, on the other hand, has seen economic data turn lower and that’s helped the EUR/USD pair to carve out a bearish sequence after setting a fresh yearly high in July trade.
This has sent EUR/USD in a clean bearish trend that’s run for more than 775 pips as the July high at 1.1275 has led to a push down to a test of 2023 support at the 1.0500 handle in EUR/USD.
EUR/USD Daily Price Chart: 1.0500 Re-Test
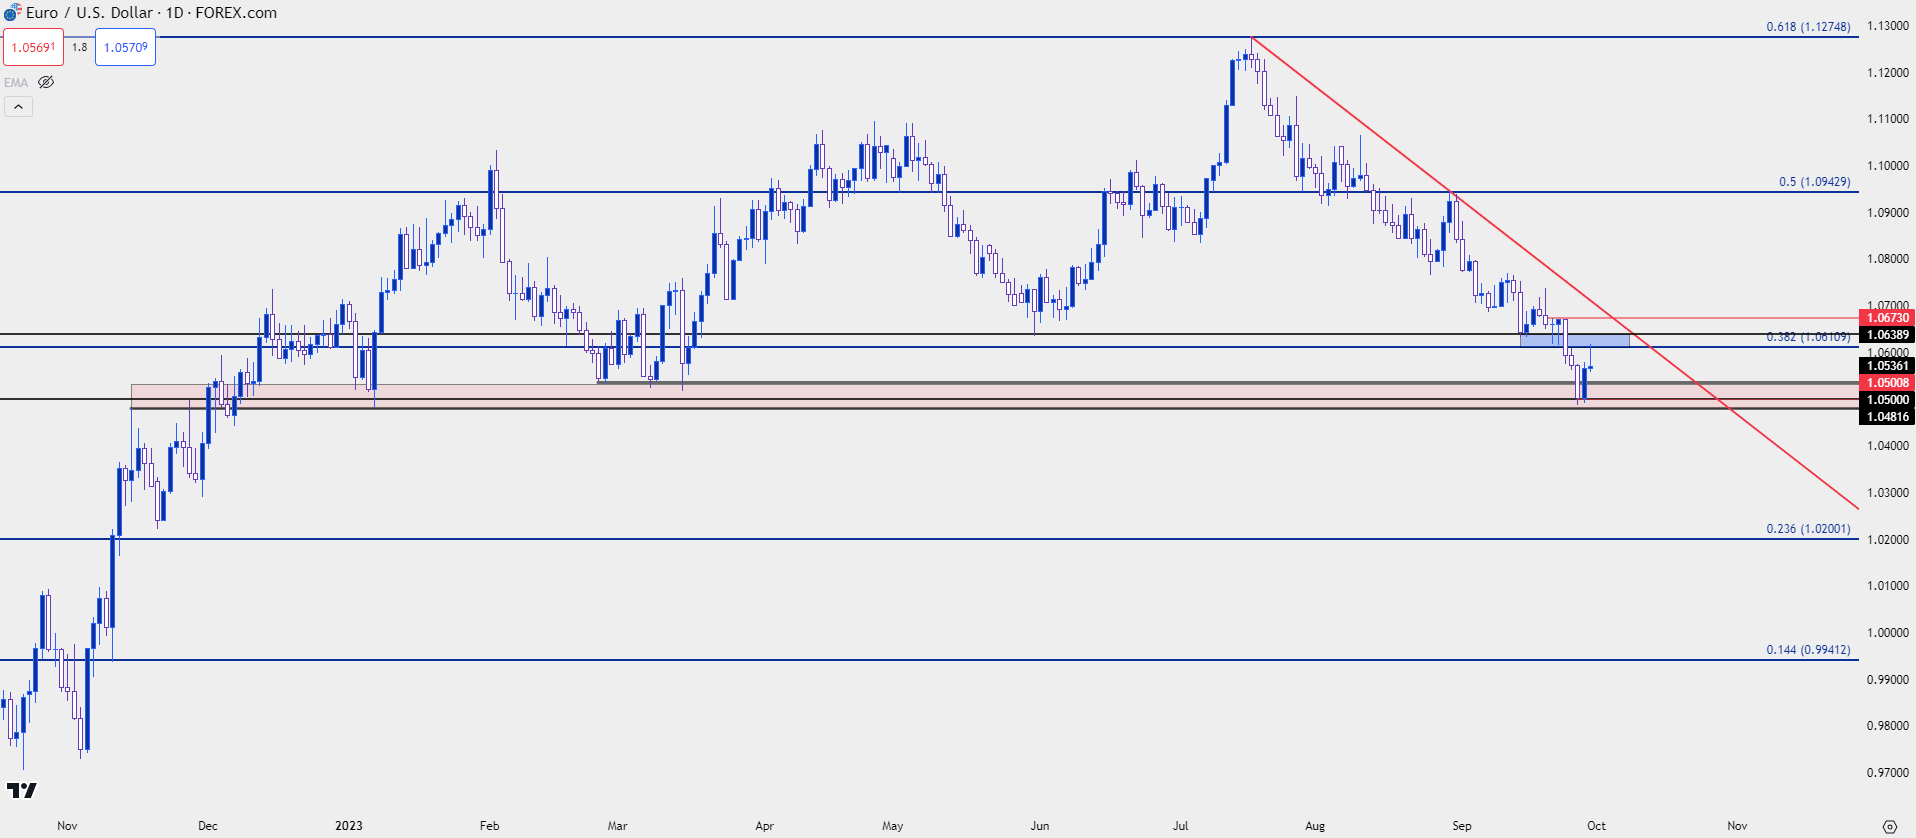
Chart prepared by James Stanley, EUR/USD on Tradingview
Along with that theme has been a rather dramatic rise in US Treasury yields. There was a bit of respite in the higher yield theme in March, right around the time that trouble began to show in regional US banks (largely in response to higher rates) and that brought along the thought that the Fed might slow their approach with inflation. And it did lead to a couple of rate meetings without a hike, such as we saw last week.
But that didn’t necessarily help inflation and as the bank has had to remind markets that they might not be that close to rate cuts, we’ve seen a fast adjustment show up. Below, we can see 10-year Treasury yields pushing up to a fresh 16-year high.
In April, on the heels of that scare in US banks, the 10-year yield had dropped down to 3.25%. This week, it high 4.7% to highlight a massive change in a relatively short period of time and given that this is the benchmark rate it carries with it a number of possible reverberations that haven’t yet been seen in entirety.
Tthe March inflection point is important, as we can see in both the US Dollar and Treasury yields the entire pullback from that theme has been priced-out, and as I shared in this week’s webinar that same paring back hasn’t been seen everywhere.
US 10 Year Yields – Monthly – 16-year highs (indicative only, not available on Forex.com platforms)
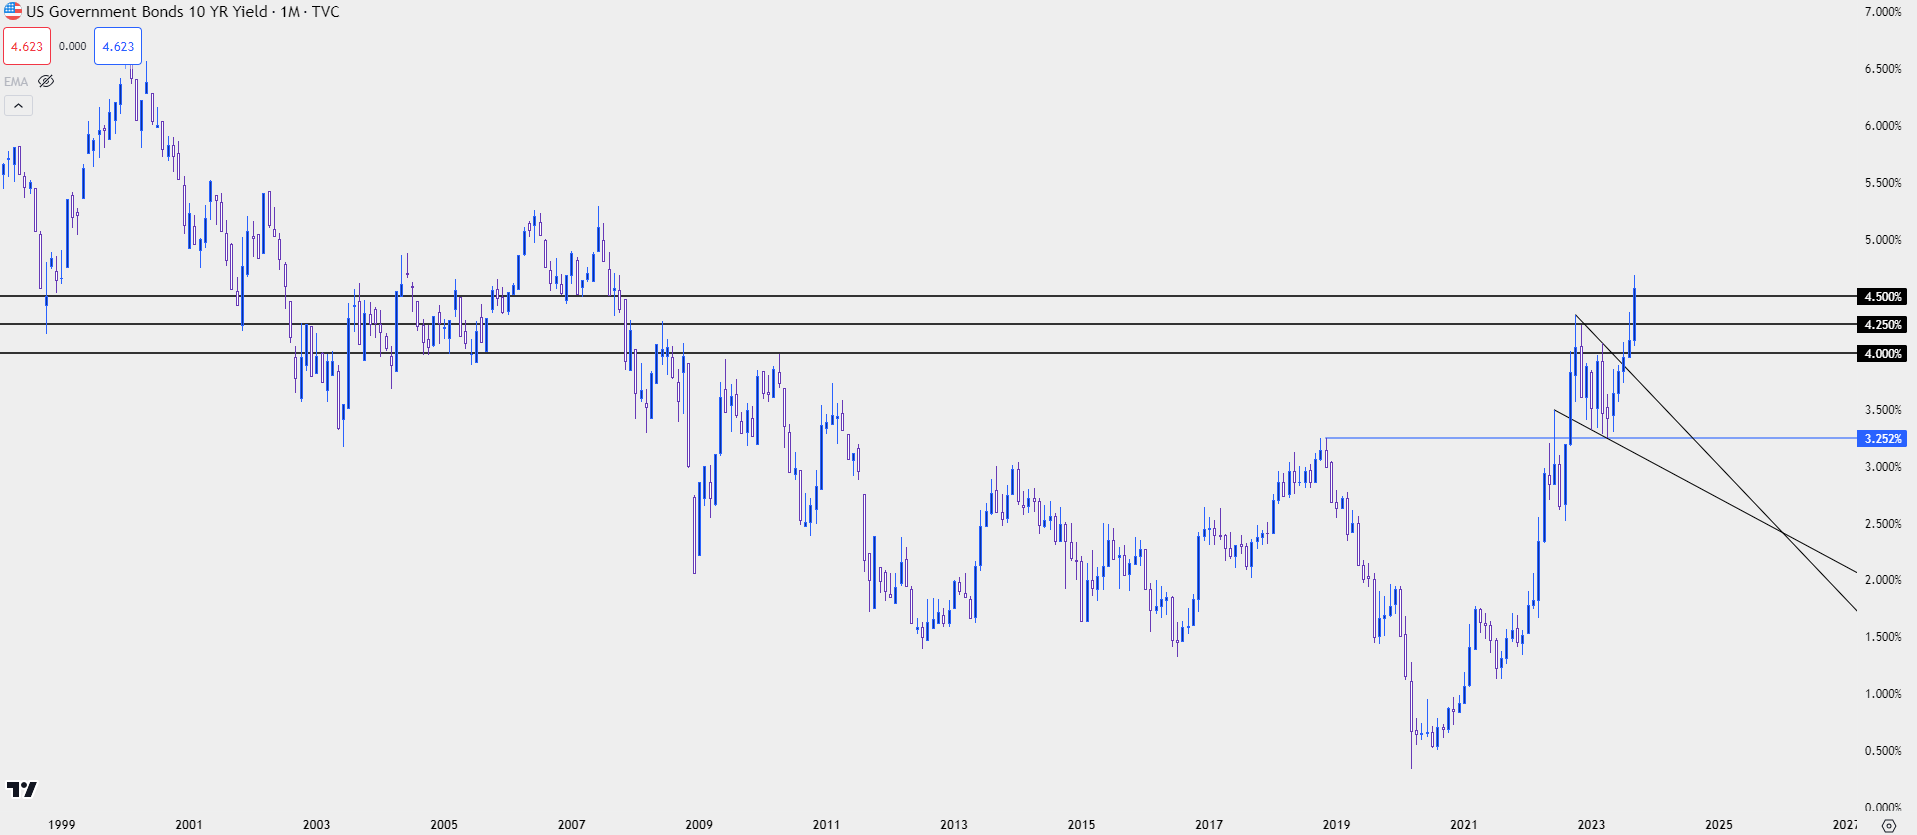
Chart prepared by James Stanley; data derived from Tradingview
US Dollar
In the USD, the high from March was at 105.88 and that held as the 2023 high until last week. Bulls prodded a breakout, and this is the 11th consecutive week of gains for DXY. I had talked about this a month ago when that streak hit an important point of six weeks, and as shared then, seeing such a consistent one-sided streak in such an important asset is rather rare, as there’d only been six other instances of six consecutive weeks of gain or more.
Now that we’re at 11 weeks, there’s been only one other prior instance of that in the past decade and it happened 10 years ago. That instance went for 12 weeks, after which the USD pulled back for two weeks, found support at prior resistance and then continued the trend into 2015 trade.
That prior iteration accounted to a more than 25% run in the USD as both Euro and JPY were getting hit hard, helping to further drive the DXY.
US Dollar Weekly Price Chart (indicative only, not available on Forex.com platforms)
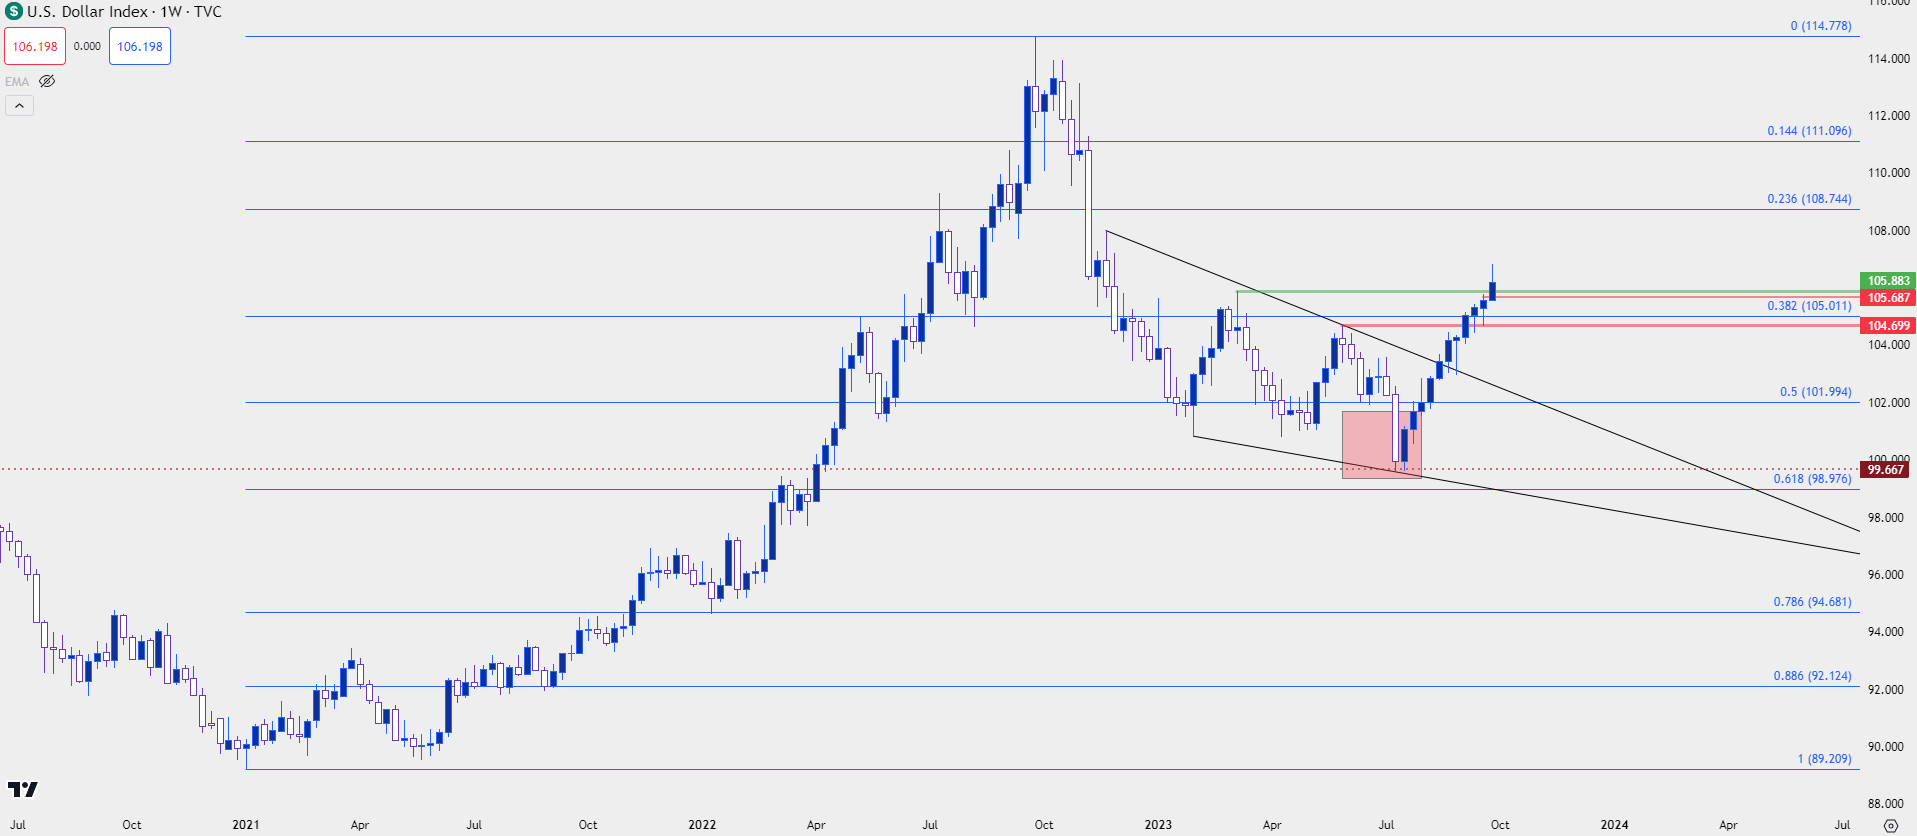
Chart prepared by James Stanley; data derived from Tradingview
USD/JPY
Along with that theme in the US Dollar and US rates we have an ongoing saga in USD/JPY.
The Bank of Japan has avoided hiking rates as the rest of the world has adjusted to higher rates of inflation. That’s kept the carry trade running in USD/JPY and that remains a fact today, as higher US rates match with low Japanese rates to continue positive carry in the pair.
And with the BoJ showing no signs of possible hikes on the horizon, markets have done what they generally do, which is seek out the most viable risk-adjusted return. But the pathway for the trend isn’t a clean road without risk, and perhaps significant risk based on the tolerance of Japanese policymakers.
On the other side of the bullish trend in USD/JPY, the Ministry of Finance in Japan is tasked with managing the currency, and as we’ve heard multiple times already, ‘one sided moves are undesirable’ as it can create fast changes in an economy that can have reverberations elsewhere. This is one of the reasons that the MoF directed the BoJ to intervene in the matter last year. They sent a directive to buy JPY in the open market and this served to reverse the bullish trend, hitting stops along the way.
Their timing was impeccable, as that meshed with US inflation levels coming down and as we saw in November, USD broke down as stocks broke out on the hope that the US had turned the corner with inflation.
In USD/JPY – this amounted to a 50% retracement of the prior bullish move, with support finally showing up in January of this year. But – since January, bulls have been in-control as driven by that positive carry.
We’re now back in the same vicinity that brought out the intervention last year so naturally we’ve seen bulls slow their push. But the bigger question is how close we might be to another intervention. Last year’s announcement had the luxury of an overbought US Dollar and falling US inflation. The same can’t be said at this point, as we’ve seen the Dollar gain for 11 consecutive weeks as we move into the Q4 open.
To be sure, we have already started to hear the intervention threats out of Japan, but it’s seemed to start later this year than it did last year. Last year those threats began to show at 145 with the pair running up to 150. This cycle, those threats started to show around 147.50. But there’s also the question as to whether it would work because, again, the timing last year turned out to be very much on-point for the BoJ given themes in the USD and inflation.
USD/JPY Weekly Price Chart
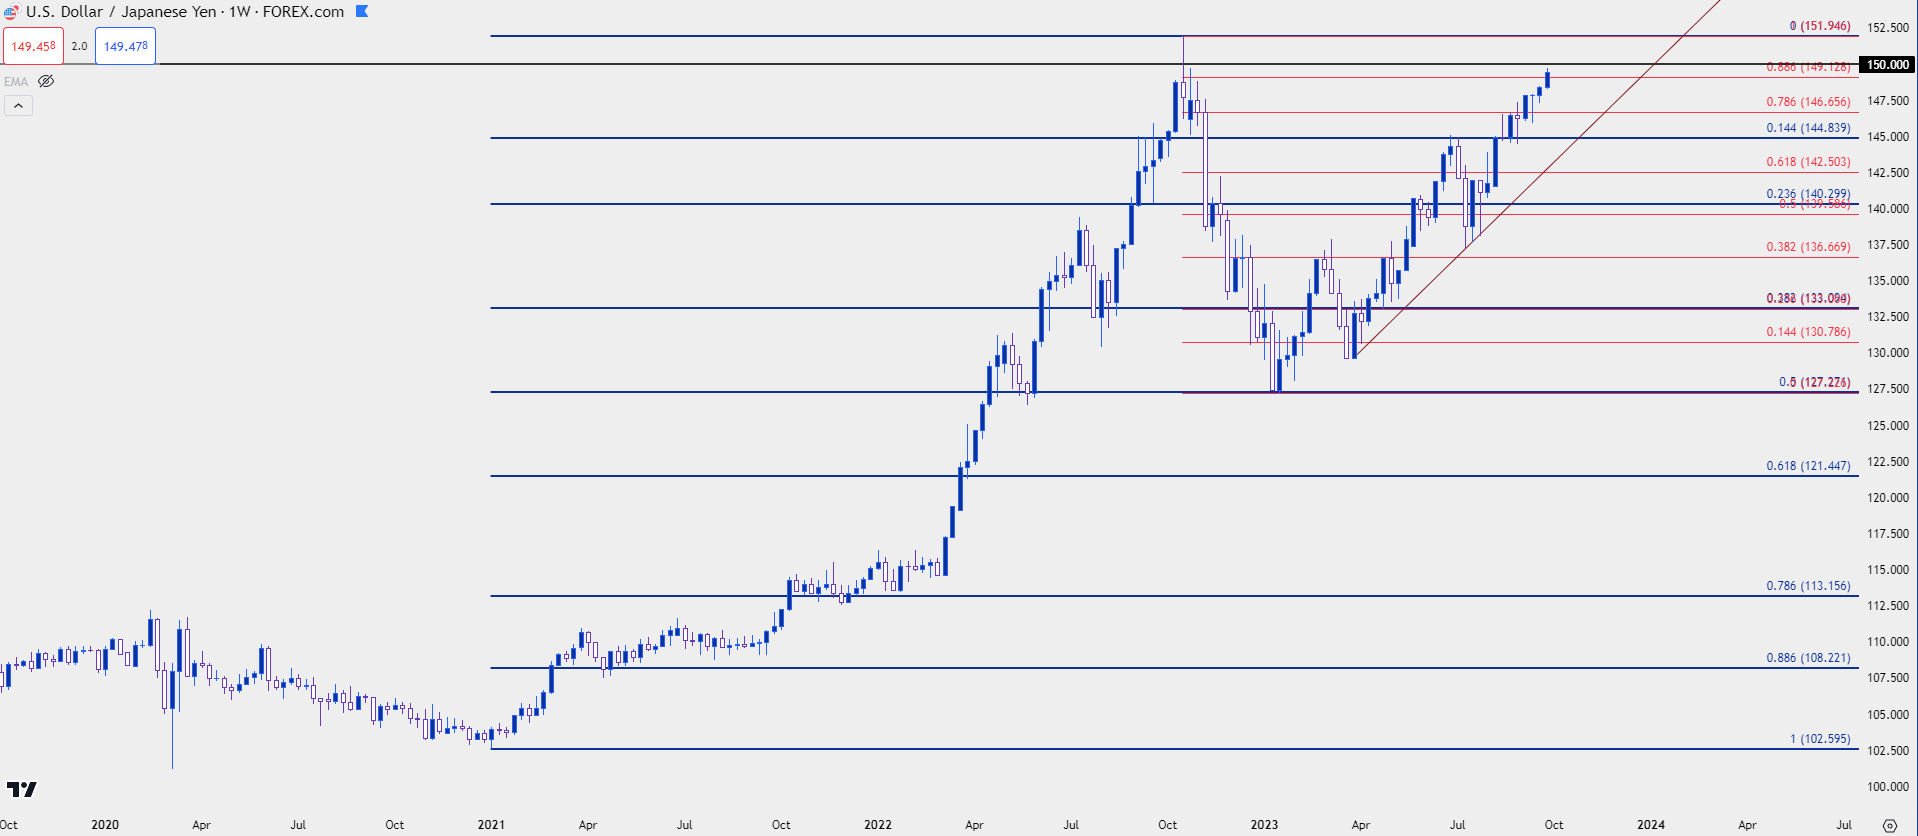
Chart prepared by James Stanley, USD/JPY on Tradingview
Stocks, SPX
While the US Dollar has pushed above its March high and 10 year yields are well above that prior March high, the S&P 500 remains pretty far away from the levels that it was trading at in March.
At the time, there remained worry that the Fed’s continued hiking campaign would push equities back into a bearish spiral, similar to what had shown in the first nine months of last year. But that risk of a banking crisis was really a positive factor for this theme, as absurd as that might sound, as the prospect of the Fed pulling back gave a lifeline to stocks and as the FOMC even forecasted rate cuts for next year, equity bulls ran like it was 2021.
But matters have been shifting over the past two months: Worry began to show in August and that’s taken on a new level of aggression in September, with the S&P 500 showing its first oversold reading via RSI since the market had bottomed last year. That oversold reading appeared on Wednesday, and led to a bounce on Thursday, but bears are back on the attack on Friday and the trendline connecting October and March lows remains at risk.
S&P 500 Daily Price Chart (indicative only, not available on Forex.com platforms)
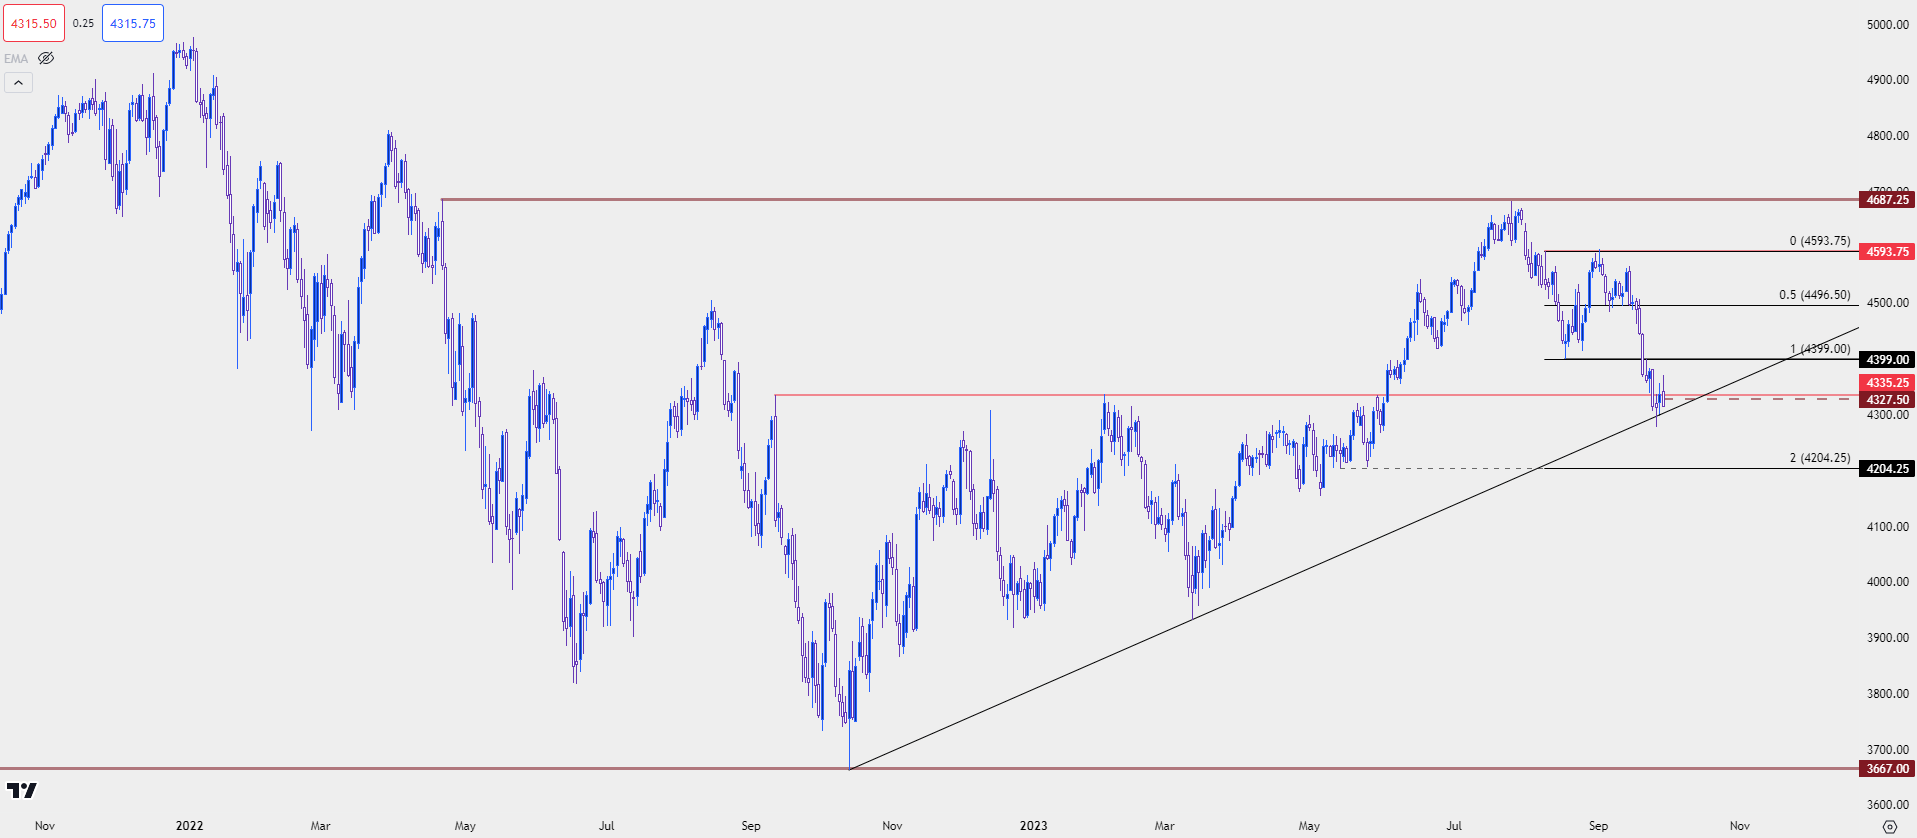
Chart prepared by James Stanley; data derived from Tradingview
Taking a step back, the big question for stocks is whether there’s re-pricing left to be seen. Equities are still holding on to gains from the bounce in March while other markets, like the USD or EUR/USD or 10 year yields have erased those moves, and then some.
From the weekly chart below, we can get some context for that question as the March low shows at 3931, more than 8% away from current prices, as of this writing.
Between current price and that level is a possible support around 4205, which would be a support level generated from the double top formation that came into play last week. There’s a swing at 4093 below that, then the 4,000 psychological level.
On the resistance side of the matter, 4400 remains key at this point as that was the neckline for the double top formation.
S&P 500 Weekly Price Chart (indicative only, not available on Forex.com platforms)
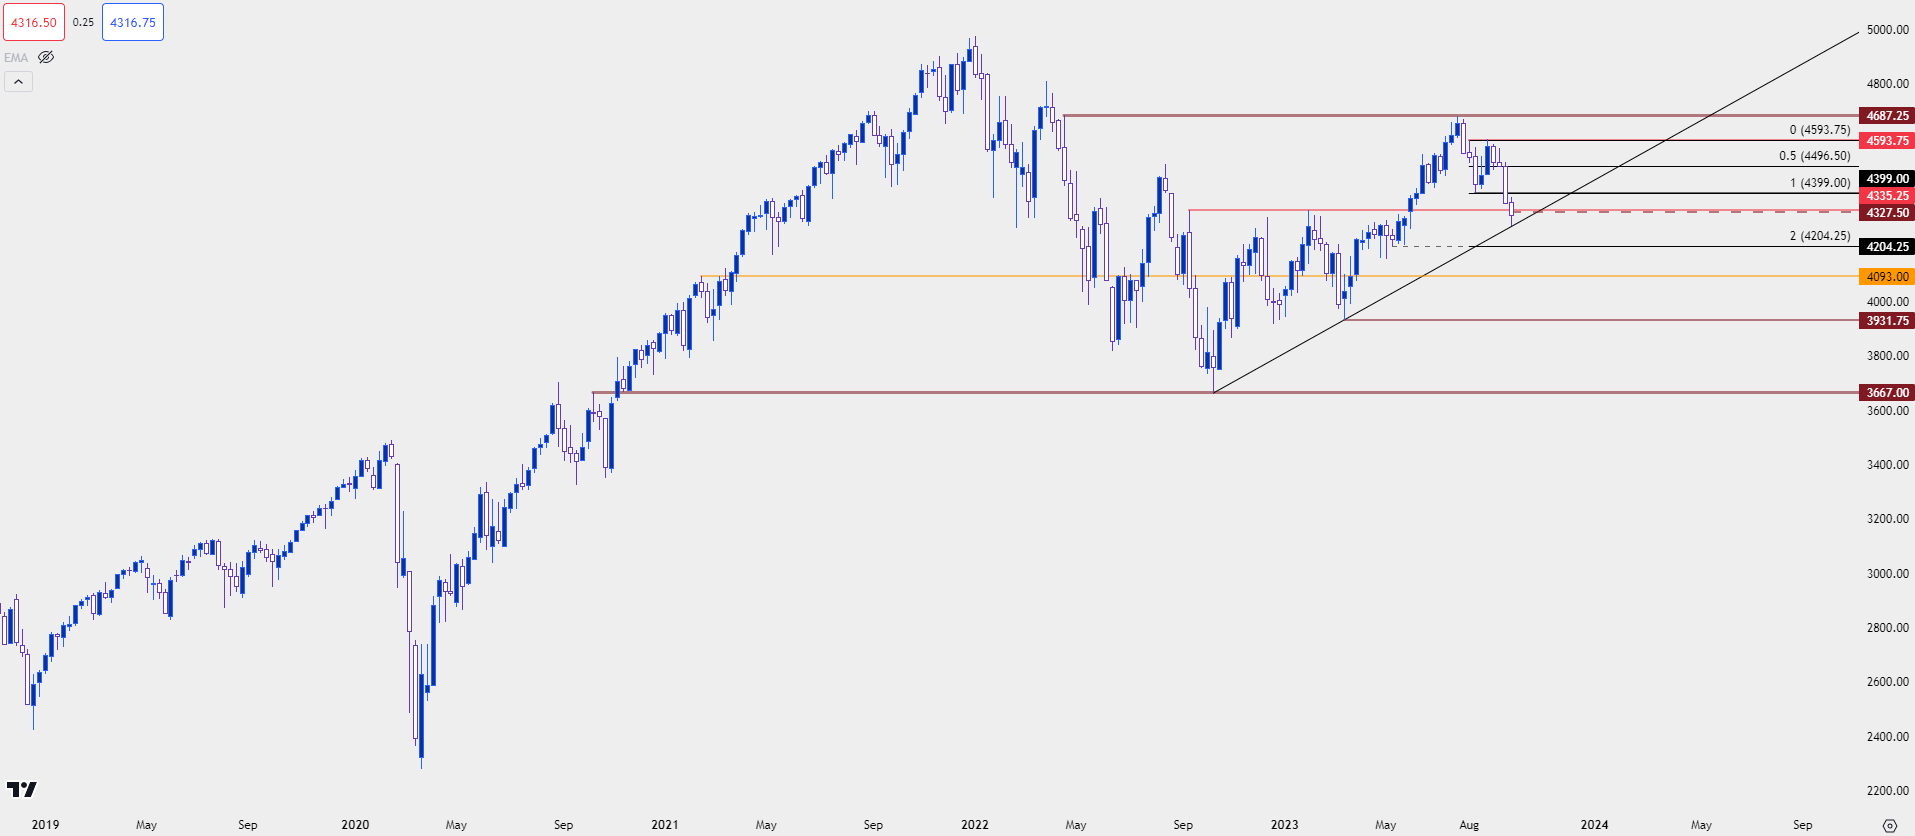
Chart prepared by James Stanley; data derived from Tradingview
--- written by James Stanley, Senior Strategist


