
USD, Gold, EUR/USD Talking Points:
- Tomorrow’s US CPI print could be a big deal for risk trends as headline CPI seems to be the data point that the Fed is using to justify their dovish policy stance.
- Since the rate cut, we’ve had a strong Core PCE report and a strong NFP report, helping to drive a large move of USD-strength that’s impact major FX pairings. The expectation for headline CPI tomorrow is at 2.3% which would keep the Fed on track to cut by 25 bps at each of their next two meetings while retaining a dovish posture into and through 2025.
- I follow these setups in the weekly webinar each Tuesday. Click here for registration information.
I’m not one to make a big deal out of a single data print but at this point it seems as though there’s a lot of importance in tomorrow’s CPI print. So far this year there’s been an element of stall or entrenchment with Core PCE which increased for the first time in over a year at its last read on September 27th. That helped to bring a pullback in the USD last week which was hastened on Friday behind a really strong NFP report.
On the below chart, I have headline and core CPI along with Core PCE and notice the blue line (headline CPI) as the data point that’s been falling rapidly of late. Last month’s 2.5% came in after a prior print of 2.9%, and tomorrow is expected to see this fall to 2.3% which would denote a strong pace of slowing inflation.
US Inflation: Headline CPI (blue), Core CPI (orange), Core PCE (silver)
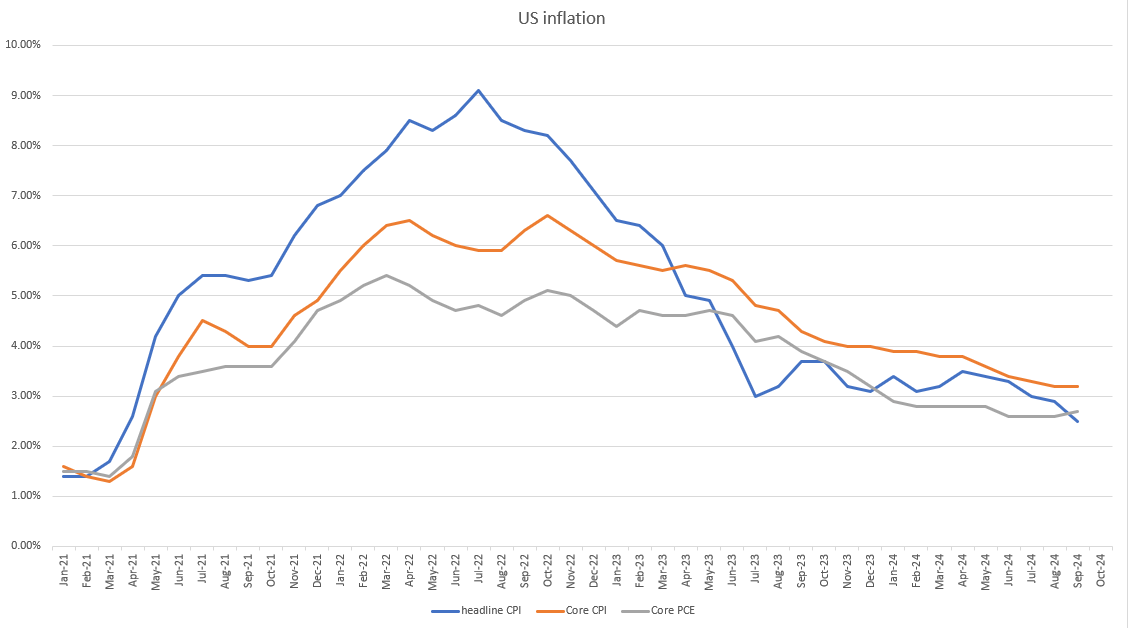
Chart prepared by James Stanley
The US Dollar was in a strong sell-off for the first two months of Q3 but that started to stall in September. The currency made a fresh low on the morning of the Core PCE print but, once again, sellers couldn’t seize the opportunity and price once again pulled back. Monday of last week saw a bit of continuation but that brought a higher-low and then the Q4 open the day after saw a completely different tone take over as the USD jumped-higher and broke out of the falling wedge formation.
As looked at in the webinar yesterday, the Greenback had held the resistance around 102.55 for a few days, leading to dojis on the daily for Monday and Tuesday. Bulls are stretching ahead of tomorrow’s CPI release and if we see headline CPI come out above 2.3%, I think we’ll see more stretch with focus on a resistance zone up to around 103.32-103.46.
Perhaps the more amenable scenario for trend traders would be headline CPI at 2.3% or less which could provide motive for a pullback, at which point we could read just how aggressive buyers remain to be. A re-test of support at that prior resistance around 102.55 would be an aggressive hold and higher-low, while 102.29 remains in-play, as well. If we do see a pullback stretch, the 101.82-101.92 zone remains of interest and that’s something that I’d equate with EUR/USD stretching up to around 1.1055.
US Dollar Daily Price Chart
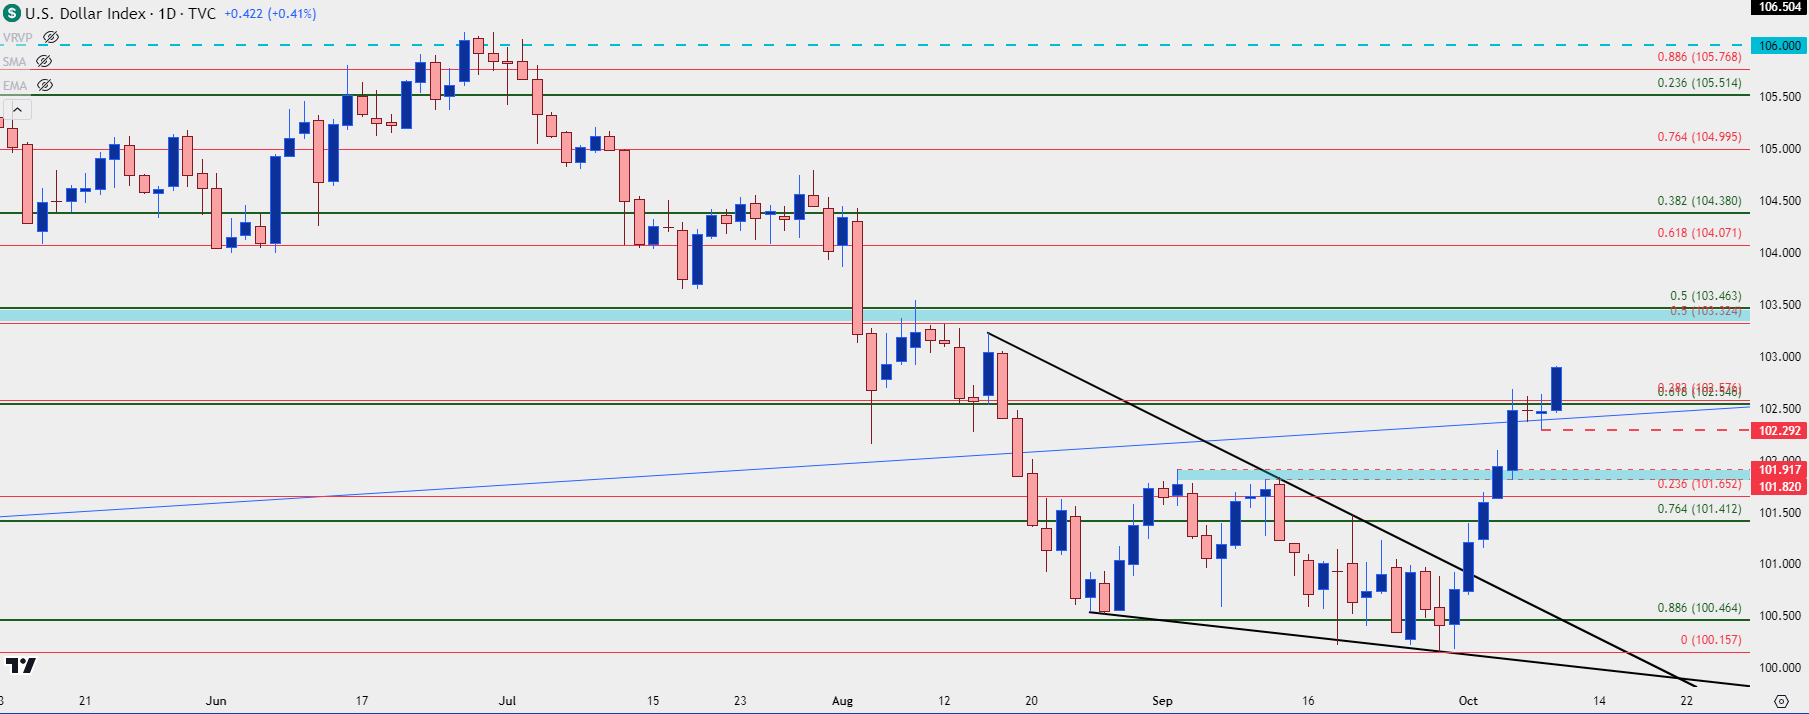 Chart prepared by James Stanley; data derived from Tradingview
EUR/USD
At this point EUR/USD bears have taken steps to retain control. Yesterday’s pullback saw defense of the 1.1000 level with sellers holding the high a mere 2.7 pips inside of the big figure. This is like the mirror image of September, when prices pulled back from 1.1000 ahead of the ECB meeting and held support just two pips above that 1.1000 price.
The complication at this point is the pair is trading below the Fibonacci level at 1.0943 and that seems an inopportune time to chase the move ahead of the CPI report tomorrow morning. But, if we do get pullbacks, the 1.0960 Fibonacci level would be an aggressive show of lower-high resistance, with 1.1000 just after, and 1.1026 and 1.1055 levels above that.
EUR/USD Daily Price Chart
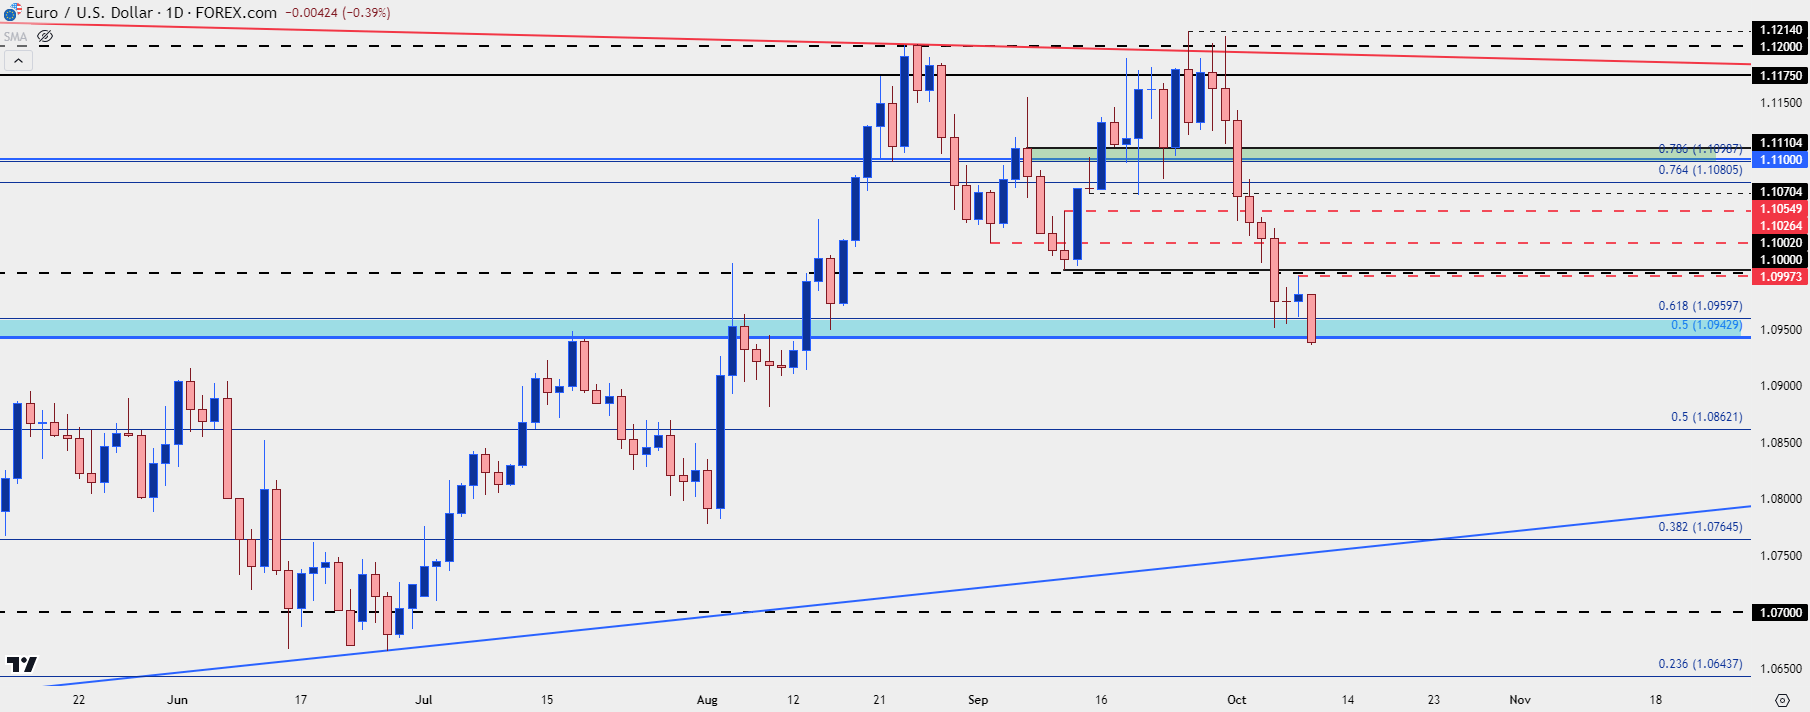 Chart prepared by James Stanley, EUR/USD on Tradingview
USD/JPY
As part of that USD reversal that’s shown so far in Q4, USD/JPY has shown considerable drive. And already many are proclaiming that the carry trade is returning, but if looking at rate expectations through next year, that argument doesn’t seem to make much sense. Even with the strong Core PCE report and the NFP data, markets have merely pushed back expectations for more rate cuts, with the Fed expected to continue loosening through next year.
That, of course, narrows the rate divergence in the pair, which is what drives the carry. As I shared in the webinar yesterday, I think this is more of a short cover theme as those rate cut expectations have gotten pushed back, following an aggressive sell-off from July through September.
The 150-151.95 zone has held incredible importance in USD/JPY over the past couple years. This is what marked the highs in both Q4 of 2022 and 2023 before becoming support in Q2 of this year. If we get back up to that zone, longer-term carry traders could be motivated to get out of positions ahead of expected cuts from the Fed next year.
But, also as noted in that webinar yesterday, near-term price action is undeniably bullish as we’ve seen a continuation of higher-highs and lows, with yesterday printing a dragonfly doji at a confluent spot of Fibonacci support.
If we do see USD-strength stretch after CPI tomorrow, I’m looking for a test of the 150.00 zone in the pair, with 150.77 and 151.95 above that.
USD/JPY Daily Price Chart
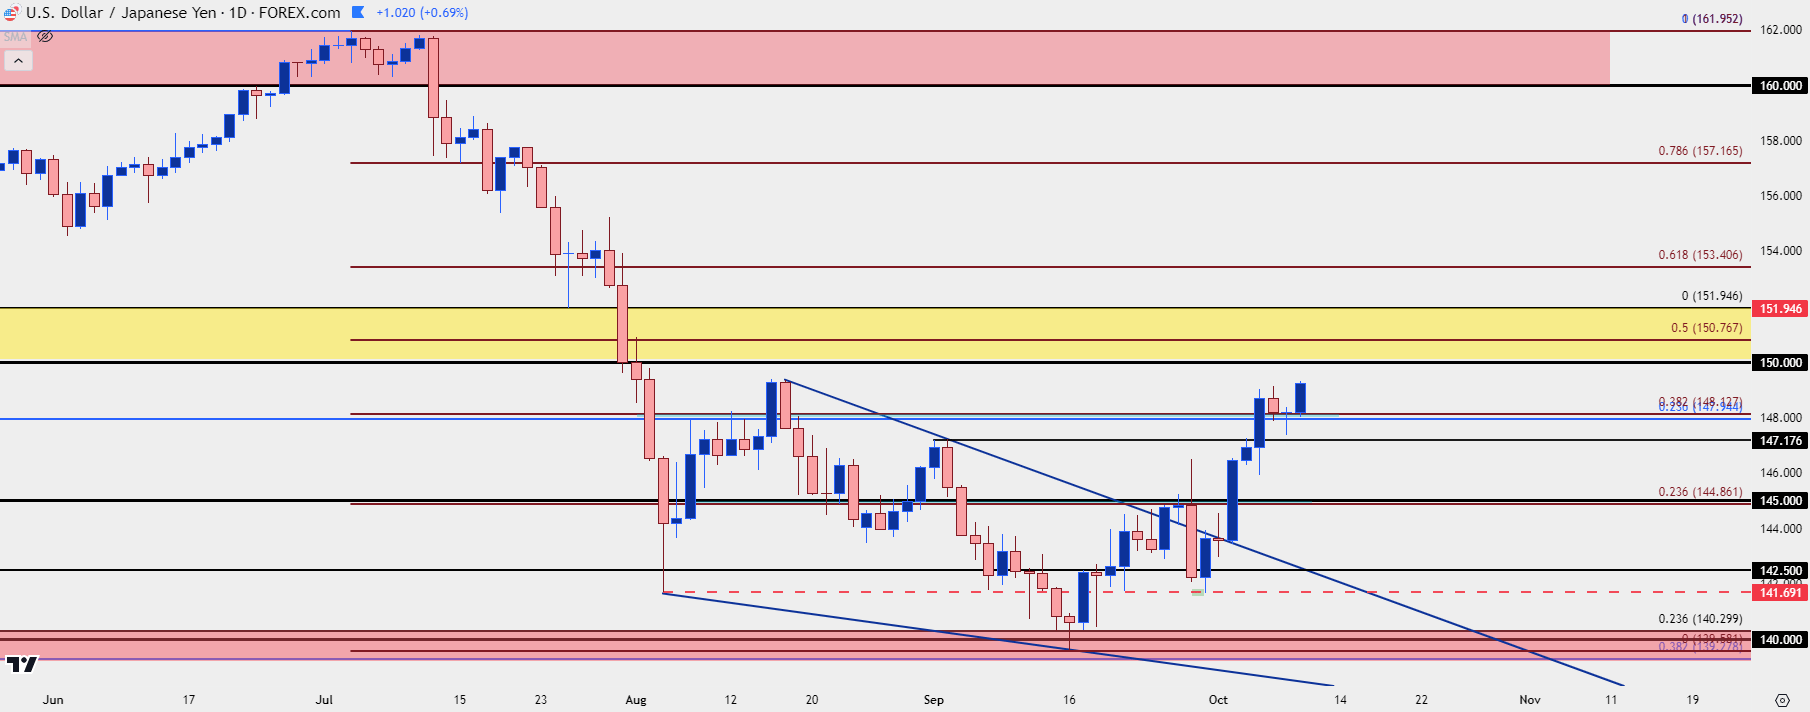 Chart prepared by James Stanley, USD/JPY on Tradingview
Gold
I wrote about gold earlier this morning and as of this writing, it’s still holding higher-lows in that pullback scenario. But I wanted to look at it again here as I think this could be one of the more interesting commodity markets around the CPI print tomorrow.
The 2600 level is clearly delineated: This was the swing high after the rate cut announcement and until this week, that was the last element of pullback that was seen in gold. It didn’t last for long, however, as support at 2550 traded shortly after, leading to another leg of strength. But as I looked at in this video, the higher-lows that showed after that support test were the early stages of the bullish continuation move.
At this point, we haven’t yet seen 2600 trade as support. After the breakout last month, buyers held higher lows at 2602.57 and in the most recent episode, buyers have again held a higher-low, this time around 2604.82. There are no signs yet that the pullback is over – but for CPI tomorrow, particularly if we see a ‘hot’ print, that could give motive for a deeper pullback and perhaps even a test of 2600.
The reaction to that is what I’m interested in as it would be a way that bulls could show their hand, by coming into defend the big figure which is now confluent with a bullish trendline taken from August and September swing lows.
Gold Daily Price Chart
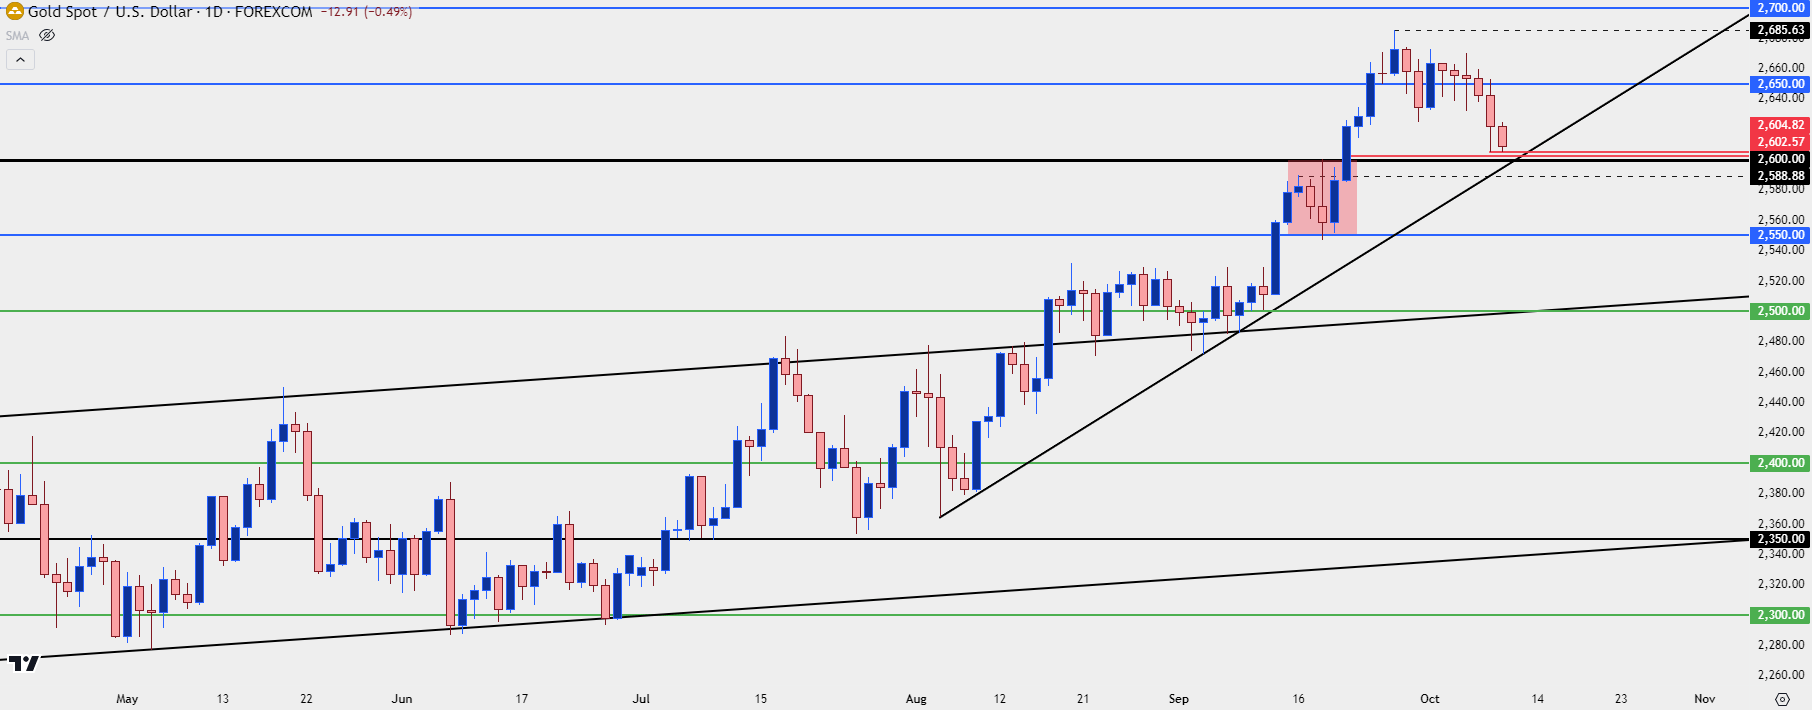 Chart prepared by James Stanley; data derived from Tradingview
--- written by James Stanley, Senior Strategist


