US Dollar Talking Points:
- The US Dollar has pulled back from the support looked at yesterday, and this begins to open the door for longer-term bears to respond. Last week’s breakout was intense, leading to oversold conditions in the USD from a few different vantage points.
- Now that price has pulled back the question is when – and where – bears respond to offer lower-high resistance. Given the build of support that was taken out last week, there’s a couple of areas to track just above current price action. And if sellers can’t hold the highs there, the question of bigger picture bullish reversals begins to come back into the equation for the USD.
- I’ll be discussing these themes in-depth in the weekly webinar on Tuesday at 1PM ET. It’s free for all to register: Click here to register.
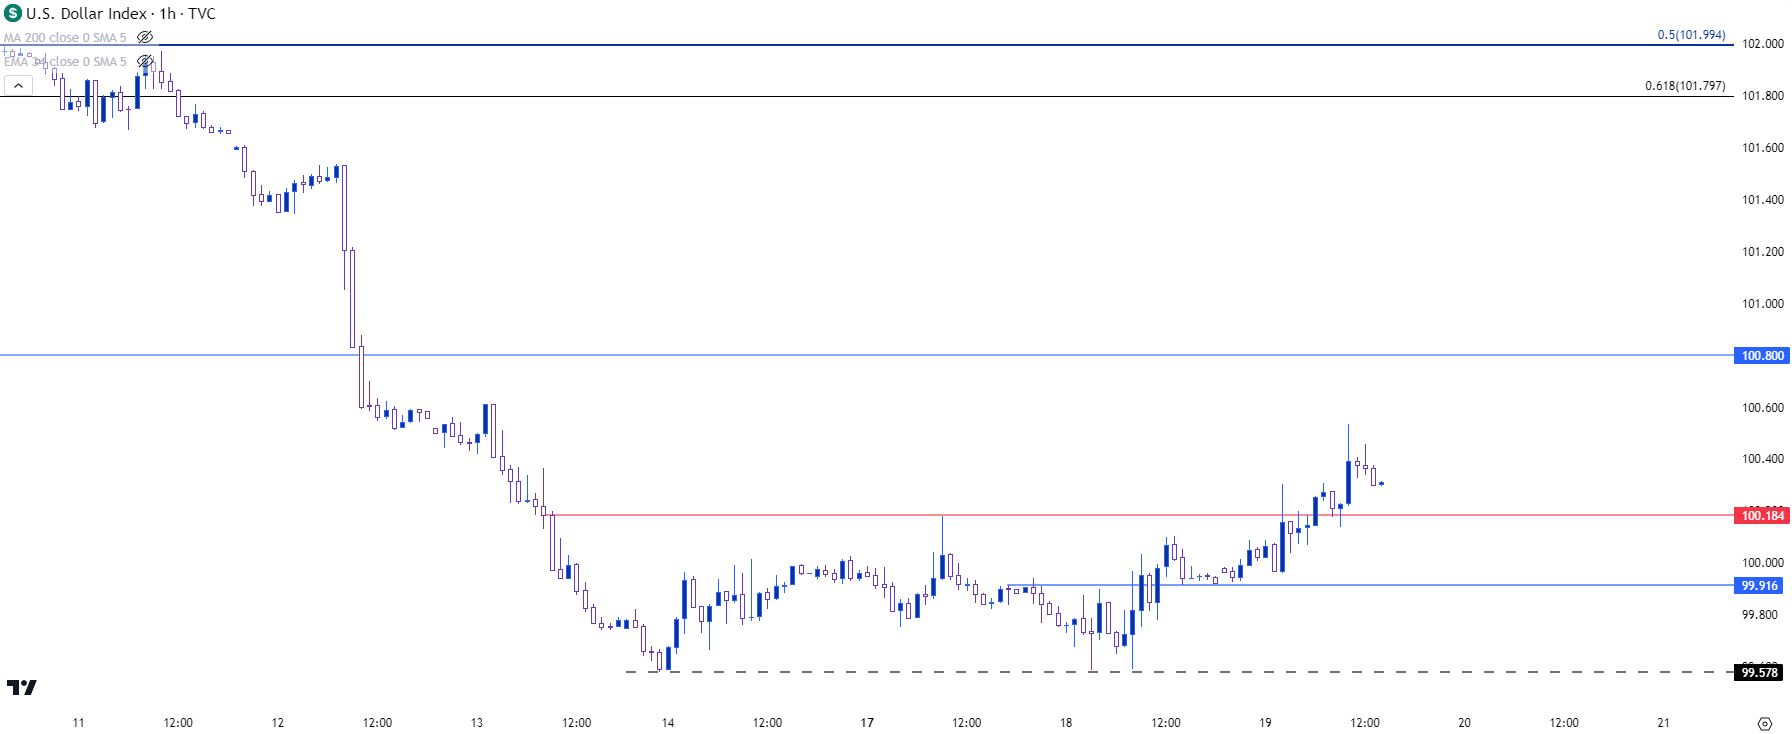
The US Dollar is putting in a bounce today from the same support that had held the lows last Friday, and again yesterday. I had looked at this in the webinar yesterday while highlighting how this could give bears the latitude to re-enter after the USD breakout moved so quickly that the currency began to show oversold conditions from a number of vantage points.
After a fresh breakout, conditions are non-ideal for trends as prices have moved so far away from nearby resistance. But, as the pullback begins to show the question is how aggressive bears might remain to be – and one way of reading that is by where sellers come in to show lower-high resistance.
Also in that webinar yesterday, I highlighted short-term resistance in the US Dollar, which has now been broken as the pullback has picked up a bit. And now at this point, with a short-term higher-high there’s an open door for that pullback to extend, if bulls can hold higher-low support. This would need to show above that prior low, which could also be considered a double bottom formation. One possible area for that higher-low support is the short-term resistance that was broken earlier today, at 100.18, with a deeper spot around the 91.92 level in DXY.
US Dollar - DXY Hourly Price Chart (indicative only, not available on Forex.com platforms)
 Chart prepared by James Stanley; data derived from Tradingview
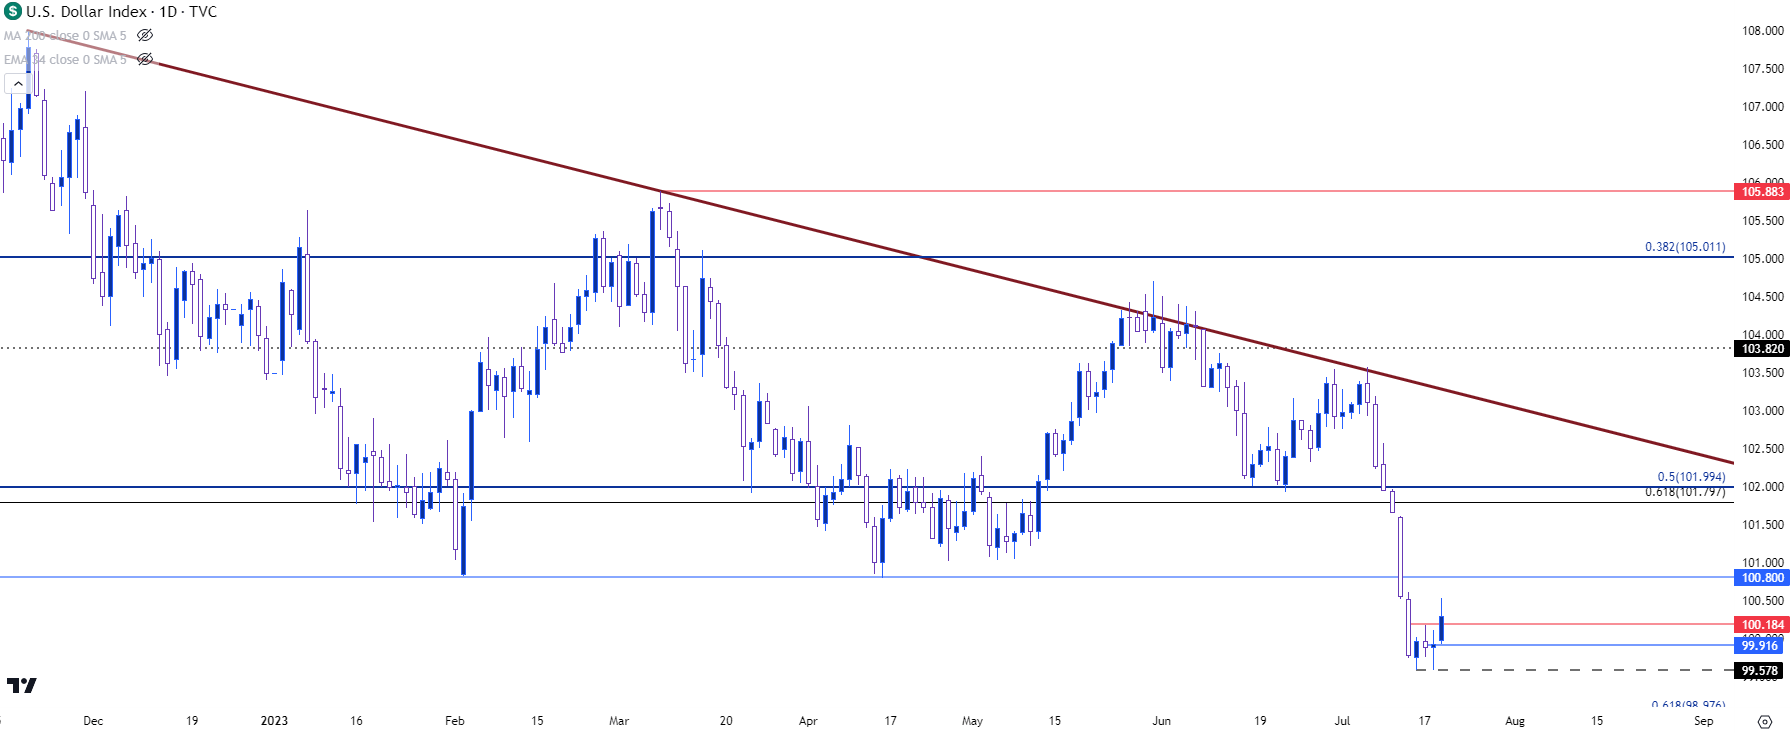
Taking a step back to the daily chart and this is still a bearish situation. The breakdown last week was intense and the bullish price action seen so far this week seems to be simple reaction to that. But, this also puts bears on the hot seat to continue the trend, and where they re-enter to show lower-high resistance can indicate just how aggressive they remain to be.
The obvious spot is the 100.80 level that had previously helped to mark the lows in the first half of the year. And above that, the 102 level looms large, as this was the June low that’s also the 50% mark of the 2021-2022 major move. A hold of resistance there could keep the bearish trend in order, with the next related question as to whether bears can pose another breach of the 100 level to drive to another lower-low.
US Dollar - DXY Daily Price Chart (indicative only, not available on Forex.com platforms)
 Chart prepared by James Stanley; data derived from Tradingview
EUR/USD
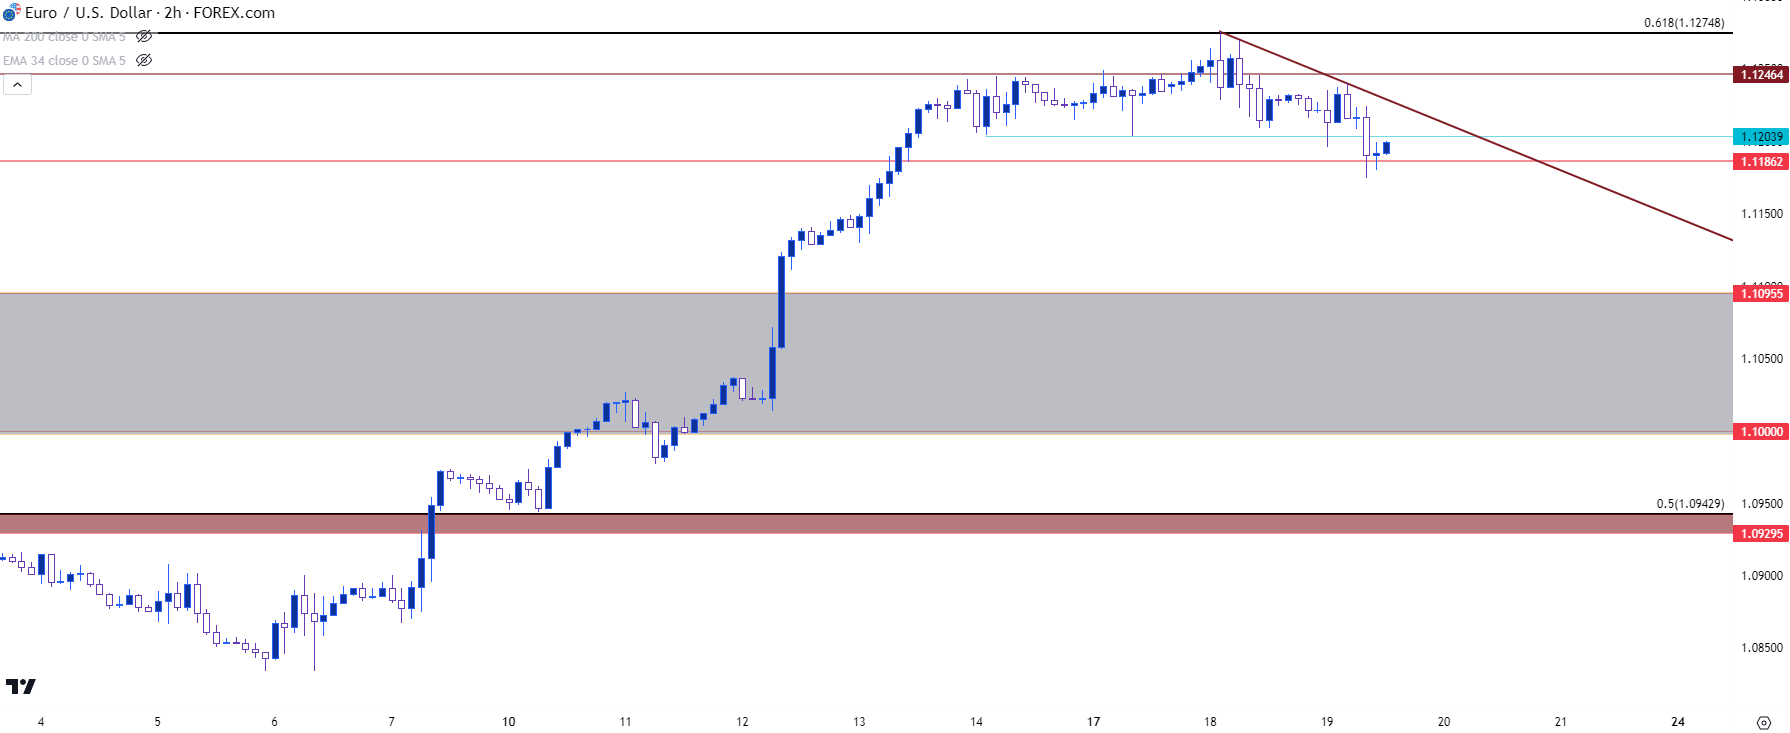
On the other side of the matter, EUR/USD has held that zone of resistance that I had looked at in yesterday’s webinar. It’s a confluent spot, from around 1.1246 up to a Fibonacci level at 1.1275. As I shared yesterday, a hold of resistance was simply a first step towards a pullback, with the next step being whether or not bears could move down to a lower-low, and that’s since taken place.
Support has so far held at the 1.1186 level but the question now is whether sellers can hold a lower-high, which would keep the door open for continued pullback. This could put focus for support back on the familiar 1.1000-1.1100 area that had offered resistance over two separate instances in the first half of the year.
EUR/USD Two-Hour Price Chart
 Chart prepared by James Stanley, EUR/USD on Tradingview
USD/JPY
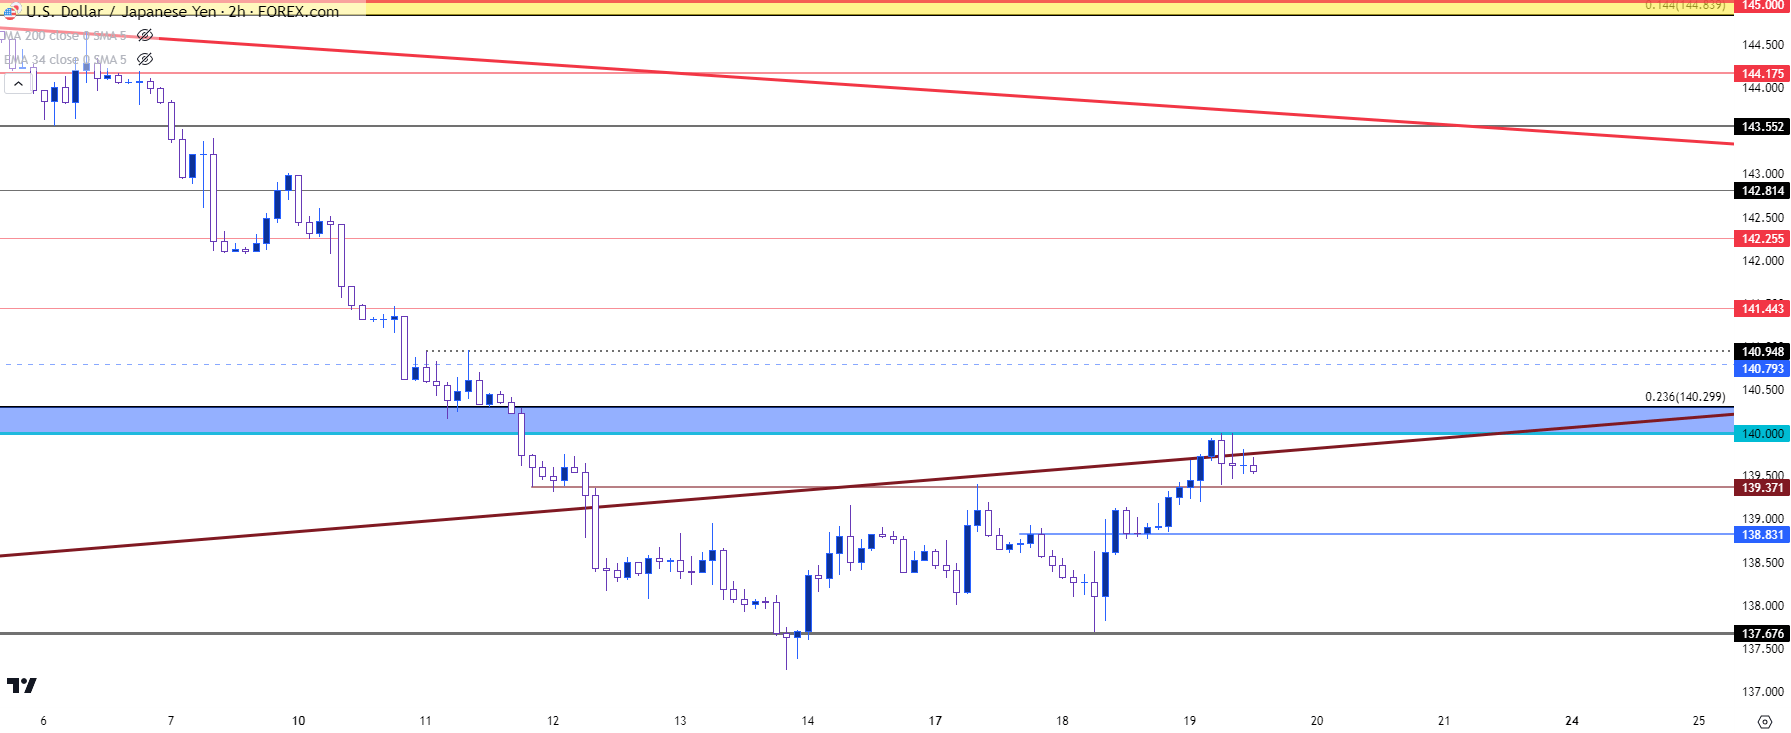
This theme seems a bit more developed regarding the USD pullback, but a similar question exists around USD/JPY. The pair took a punch last week as the US Dollar broke down, and this extended the pair’s fall from the 145 resistance test earlier this month.
But – support has since held two separate tests at the 137.68 level, and that’s led to a bounce back up to a lower-high resistance test at the 140-140.30 zone. That resistance has held two inflections already this morning, but bulls haven’t gone away quietly this time as there’s also been a hold of support at prior resistance, taken from around 139.37. There’s another spot of possible support a little lower, around 138.83, and a hold there could retain the higher-high and higher-low sequencing that’s shown on the below two-hour chart, thereby keeping the door open for bullish short-term themes (and a deeper pullback to the longer-term bearish theme).
USD/JPY Two-Hour Price Chart
 Chart prepared by James Stanley, USD/JPY on Tradingview
--- written by James Stanley, Senior Strategist


