
USD Talking Points:
- The US Dollar continues to jump and the big item at this point is the move in Treasury rates after last week’s FOMC rate decision. Stocks have taken a hit but there’s been little sign of recovery despite support, which creates a bit of worry for near-term price action dynamics in US equities.
- While the US Dollar is trading at a fresh high, eclipsing the level in March that was touched before the banking crisis brought on lower rate expectations, many other markets remain far from their March inflection points. Gold had found support at $1807 and as of this webinar was almost $100 higher. The S&P 500 was trading below 4,000 when that theme appeared in March and similarly the index remains well-elevated from those prior levels.
- This is an archived webinar that’s free for all to join. If you would like to join the weekly webinar on Tuesdays at 1PM ET, the following link will allow for registration: Click here to register.
It’s been a little less than a week since the FOMC rate decision but we’re still seeing some dynamics of that play out across markets, and we may not have seen the end of that yet.
The center point of that theme is in rates, which is creating reverberation in other areas. The big takeaway from last week’s FOMC was a reduction in the bank’s expectation for cuts next year, to two from a prior read of four. At this point, rates markets are still pricing in cuts for next year but the jostling in lower expectations from the Fed has created a strong lift for US rates and this is something that could be troublesome for stocks from two different drives: Higher rates make for a more challenging backdrop for American corporates. But it also creates opportunity cost for investors in the market.
If two-year notes are yielding 5% and prices in the S&P 500 look like they’re going to turn over, or even if there’s just the prospect of correction, this could drive investors into the Treasury to capture that yield and deductively this would mean less capital flowing into stocks.
This is how yield curves can normalize, as investors rush into capture higher rates on the short end of the curve, and as demand for those bonds picks up so do prices to reflect that additional demand; and since prices and yields are inverse the very nature of this enhanced buying demand could spell lower rates on the short end of the curve, thereby allowing for a move towards normalization.
From the below chart of yield on the 10 year note we can see a near-parabolic like move developing, which is disconcerting considering this is often considered the bellwether for debt of the world’s largest economy.
10 Year Note Yield – Weekly Chart (indicative only, not available on Forex.com platforms)
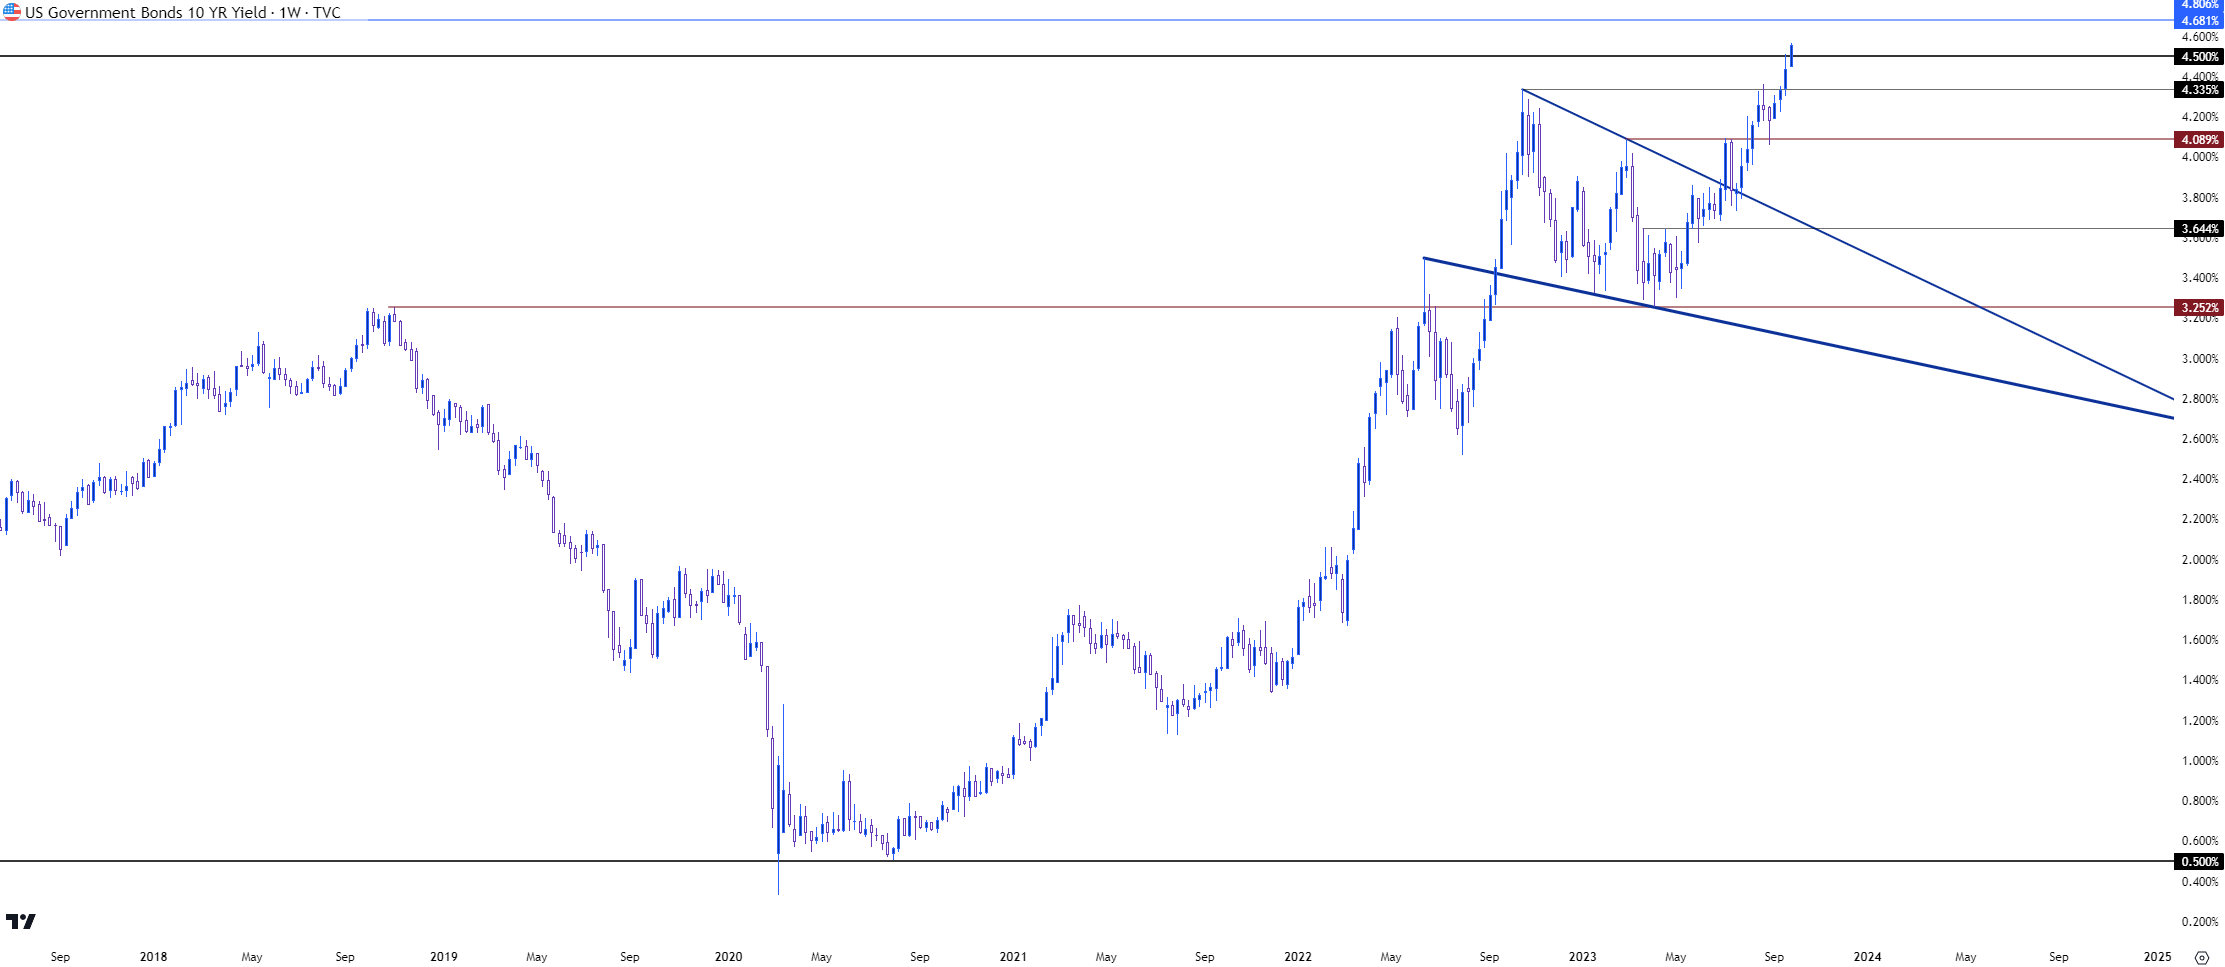
Chart prepared by James Stanley; data derived from Tradingview
This move in rates has created considerable change in many other markets. In stocks, equities continue to pullback as markets price in fewer rate cuts for next year and as I talked about in the webinar, the more disconcerting part at this point for bulls is the lack of response at support.
But, when meshing these various themes together it appears that there remains disconnect, as Treasury yields have eclipsed their March highs, as has the US Dollar, and this was largely driven by the thought or hope that the Fed may be nearing the end of their rate hikes. As evidence has suggested otherwise over the past few months we’ve seen both yields and the US Dollar recovery – but many macro markets remain far from their March inflection points.
Stocks are a good example, as the S&P 500 remains above 4300 as of this writing and back in March the index was below the 4,000 level. Gold tells a similar story, as it was digging out support around $1807 in March and we’re almost $100 higher at this point.
This doesn’t mean that there can’t be a correction – because there can. In the S&P 500 prices broke below the neckline of a double top formation last week and this has opened the door for bears to take their shot. Prices are currently at a fresh three month low and there’s a bullish trendline approaching that project to around 4300 today. Below that, the 4206 prior swing is the next key spot of support on the chart.
S&P 500 Daily Price Chart (indicative only, not available on Forex.com platforms)
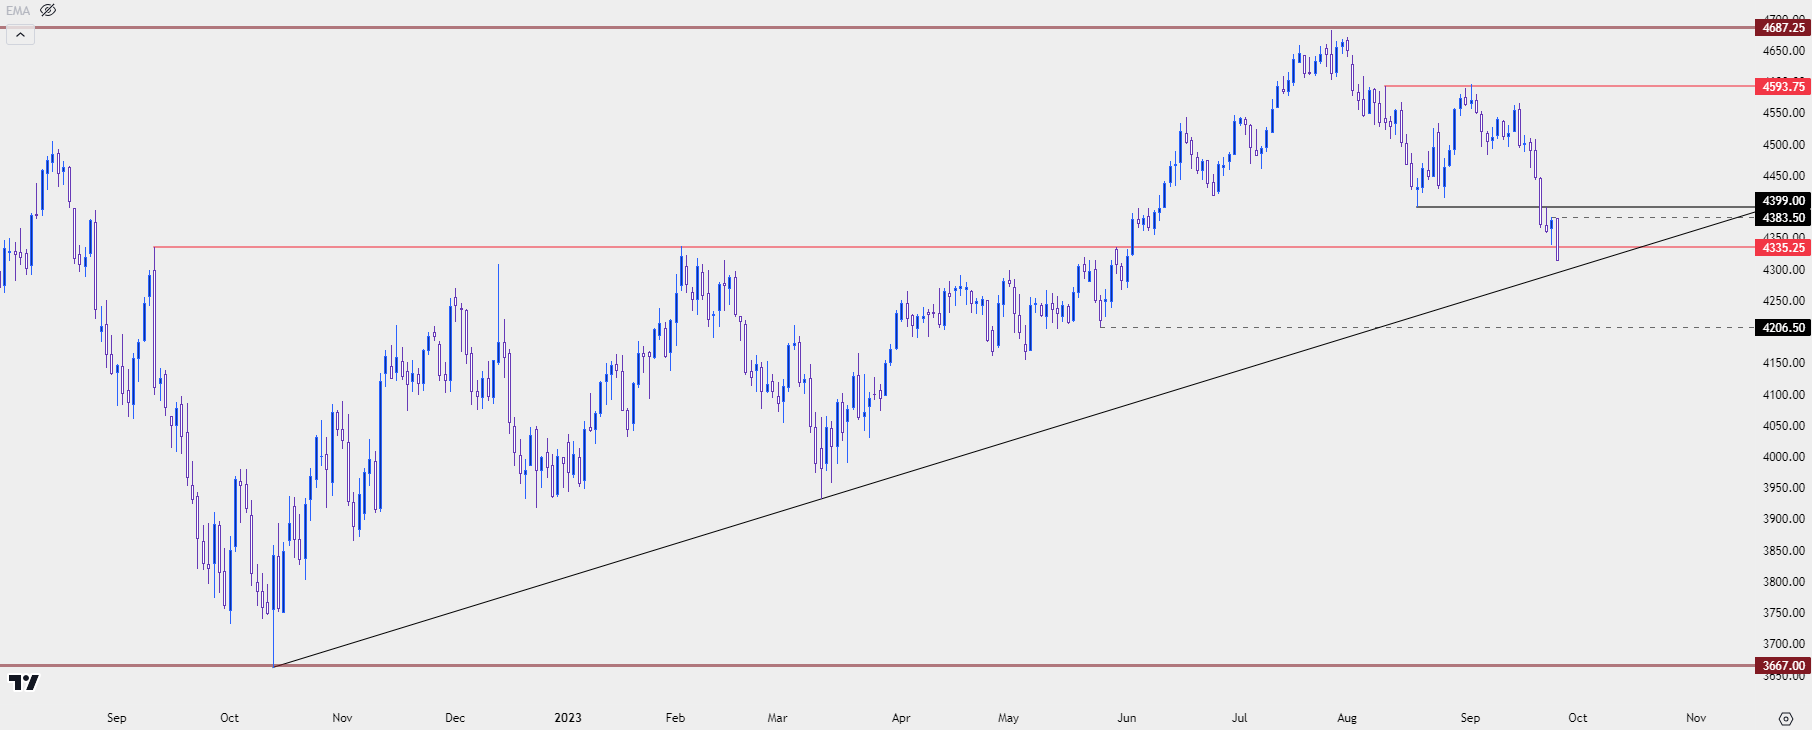
Chart prepared by James Stanley; data derived from Tradingview
US Dollar Working on Week 11
Going along with that theme of stronger US rates on a less-dovish FOMC, the US Dollar is now working on its 11th consecutive week of gains on the weekly chart. This has been a theme that I’ve been tracking for the past month and change as such a streak is somewhat rare. There’s only been six instances of the DXY being up for six weeks or more and there’s only been one such scenario when the DXY was up for 11 consecutive weeks or more. That was back in 2014 and as I shared int eh webinar, that was at the start of a major move that ended up gaining more than 25% in the value of the Greenback into March of 2015. Of course, that’s but an anecdote as it’s only happened one time, but it does highlight how exceptionally rare such a streak is in an asset as critical as the US Dollar.
At this point, the USD is overbought from multiple vantage points but that’s not necessarily anything new. Support last week, around the FOMC rate decision, was at 104.70, so even a pullback to 105.00 could keep the door open for bullish continuation scenarios. Chasing could be challenging, considering EUR/USD is nearing a major spot of support and USD/JPY is angling closer to the 150 handle.
US Dollar - DXY Daily Price Chart (indicative only, not available on Forex.com platforms)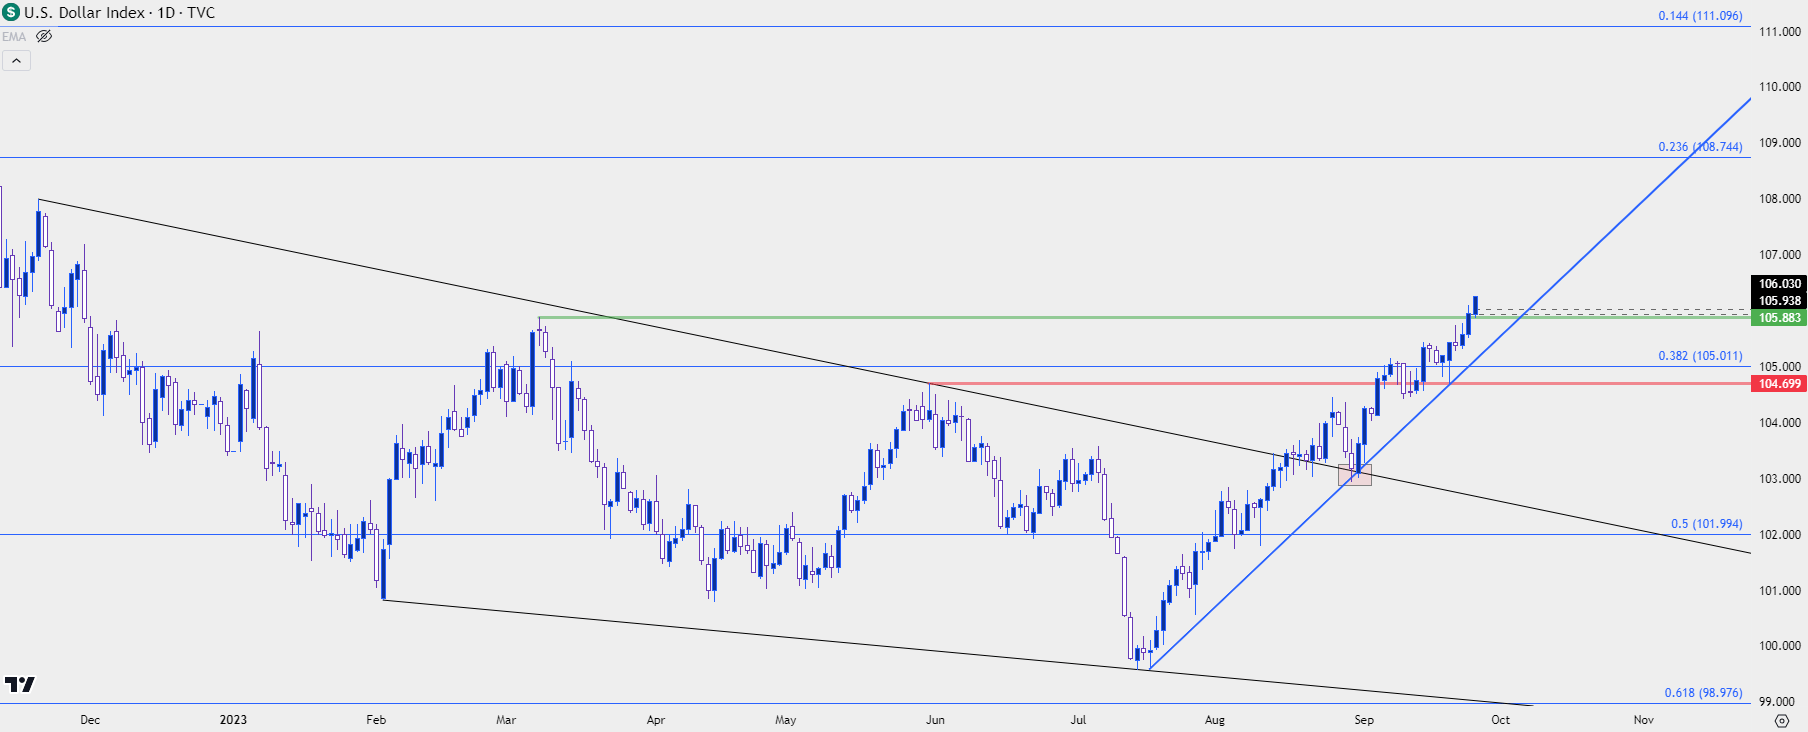
Chart prepared by James Stanley; data derived from Tradingview
EUR/USD Approaches 1.0500 – Key 2023 Support
As we came into the New Year there was the prospect of a return of USD strength. That was dashed shortly after the yearly open, however, as a dismal Services PMI print began to create worry around the US economy, and whether impact from last year’s rate hikes was starting to take a toll. That print dropped on Friday January 6th and that then led to strong run in EUR/USD (and a sell-off in DXY). But, that theme didn’t last for long as a blowout NFP report that was released less than a month later showed a robust labor market showing little sign of slowdown, and just as quickly as EUR/USD had bounced, it fell back to the 1.0500 zone of support.
That support was holding through the March open – and that’s when the banking crisis hit the US and this created a notable move of USD-weakness along with a sizable pullback in rates. This helped to lift stocks and gold and EUR/USD was along for the ride, as well.
At this point, EUR/USD has almost erased the entirety of that bounce that started six months ago. I’m tracking this support zone from 1.0482-1.0536 and this remains a key spot on the chart. At this point, with the pair being oversold from a number of vantage points, the first visit that zone could allow for reversal/pullback setups. But if bulls can’t take advantage of that long enough to allow for a more bullish response, we could see a bit of persistence at that support, like the two-week period in late-February and early-March before that bounce priced in.
EUR/USD Daily Price Chart
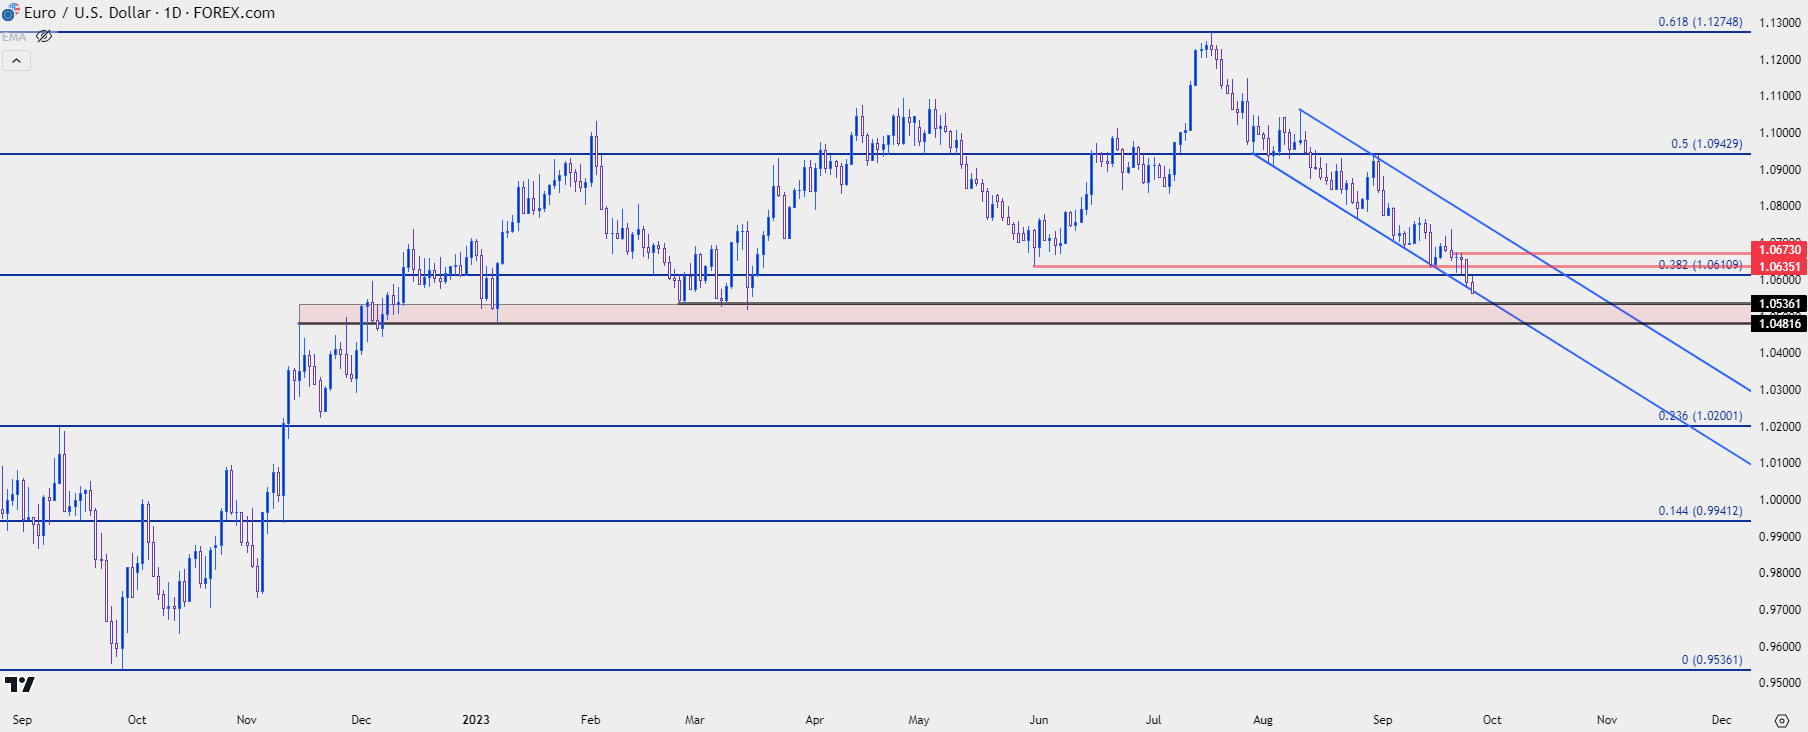
Chart prepared by James Stanley, EUR/USD on Tradingview
Gold
Gold prices remain well-elevated above that prior March swing. There was strength in gold after prices held support around $1900 a couple of weeks ago. But from the daily chart we can see change after the Wednesday FOMC rate decision last week and that seems to sync with the changes that we’ve seen in rates markets after that meeting.
At this point, the breakout from the falling wedge appears to have failed and prices are re-testing the $1900 level that’s been such a challenge of late. Key support appears around $1885 and given the number of bear traps that have shown in gold of late, traders may want to look for a confirmed breach of support as shown by a closed daily bar through that level.
The lows from March are in the 1804-1809 vicinity, so that becomes an item of bigger picture support, and there’s a Fibonacci level at 1848 along the way that remains of interest.
Gold (XAU/USD) Daily Price Chart
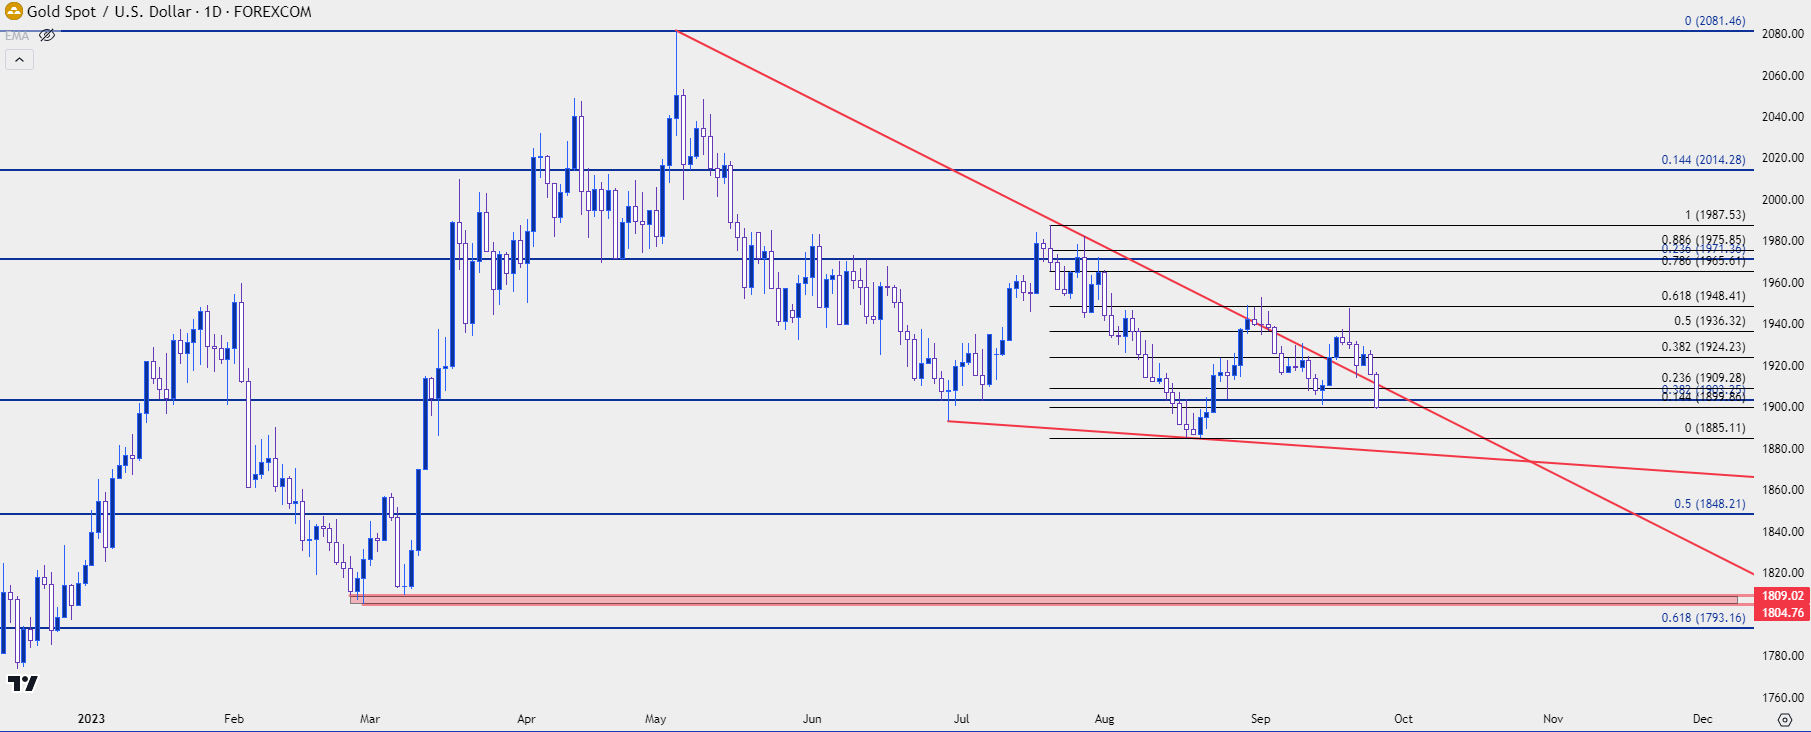
Chart prepared by James Stanley, Gold on Tradingview
USD/JPY
Will the Bank of Japan or Ministry of Finance tease another intervention? That seems like the only question that matters at the moment in USD/JPY.
Fundamentals remain decisively tilted to the long side given interest rates and with the BoJ showing no indication of change at last week’s rate decision that’s only served to continue those trends.
At this point from a technical perspective there is bearish context in USD/JPY. There’s a rising wedge pattern and a Fibonacci level coming in as resistance. That combines with price being very near the same level that brought out the intervention last year.
But whether the bearish side fills in seems to be a subjective matter, based on if someone at the MoF or BoJ wants to opine on the topic which could, in essence, create a pullback and run some stops. This led me to calling this ‘picking up pennies in front of the steamroller’ in the webinar, as the large fear would be a big picture reversal if such an announcement comes out.
USD/JPY Daily Price Chart
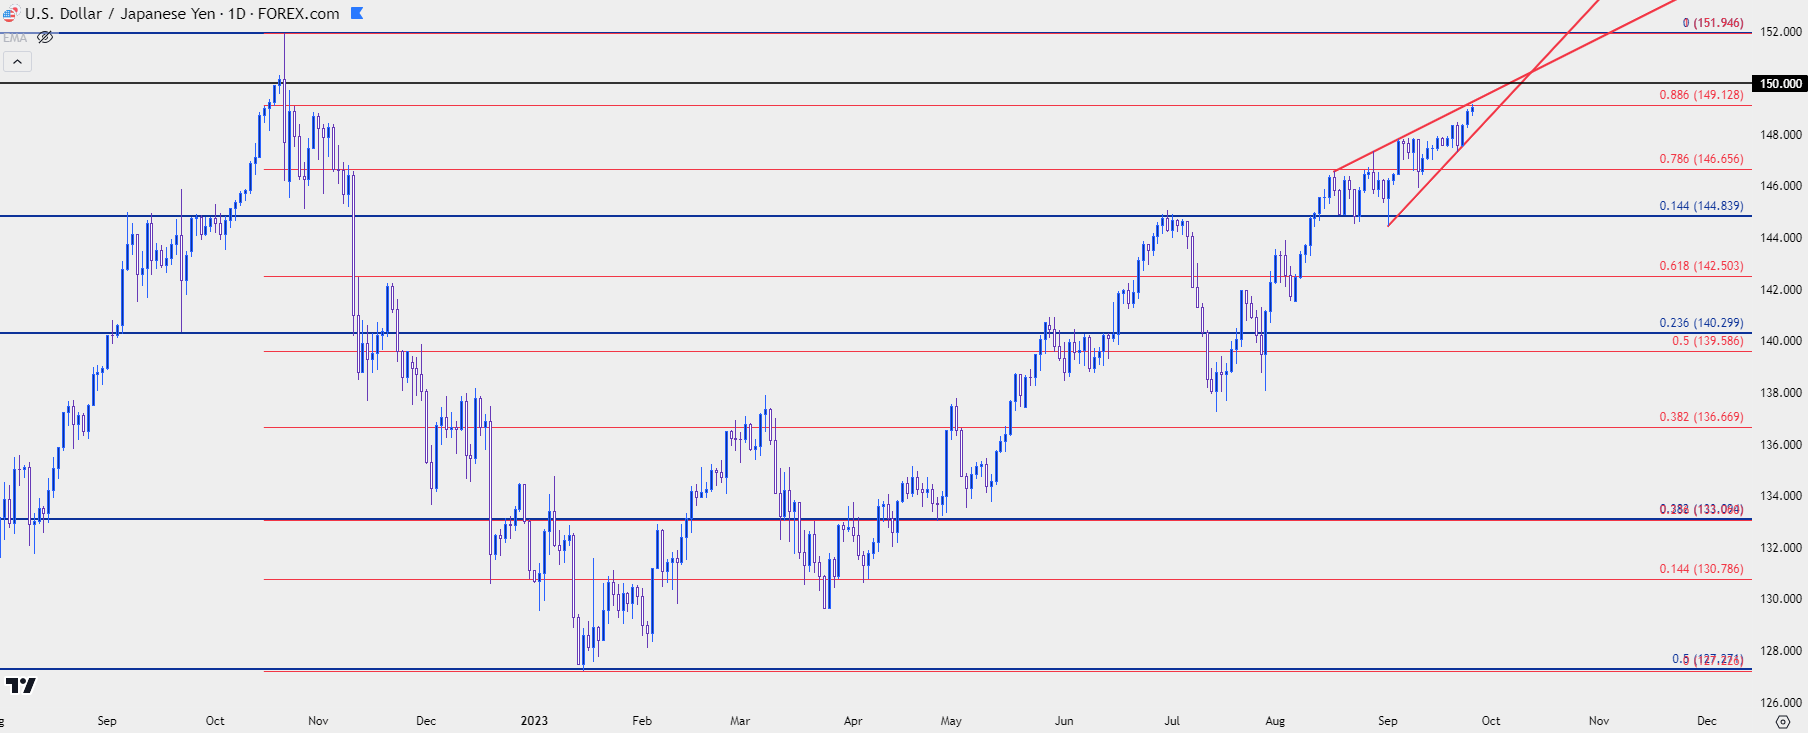
Chart prepared by James Stanley, USD/JPY on Tradingview
USD/CAD
USD/CAD put in a strong pullback from 1.3652 resistance a couple of weeks ago when it came into play. That pullback ran all the way into last Tuesday, at which point support began to show at prior resistance of 1.3387. Wednesday’s FOMC rate decision helped to produce a higher low and, at this point, there’s a short-term ascending triangle in the pair.
There is short-term support potential around prior resistance, such as the 1.3500 level or the 1.3480 level just below that.
USD/CAD Four-Hour Price Chart
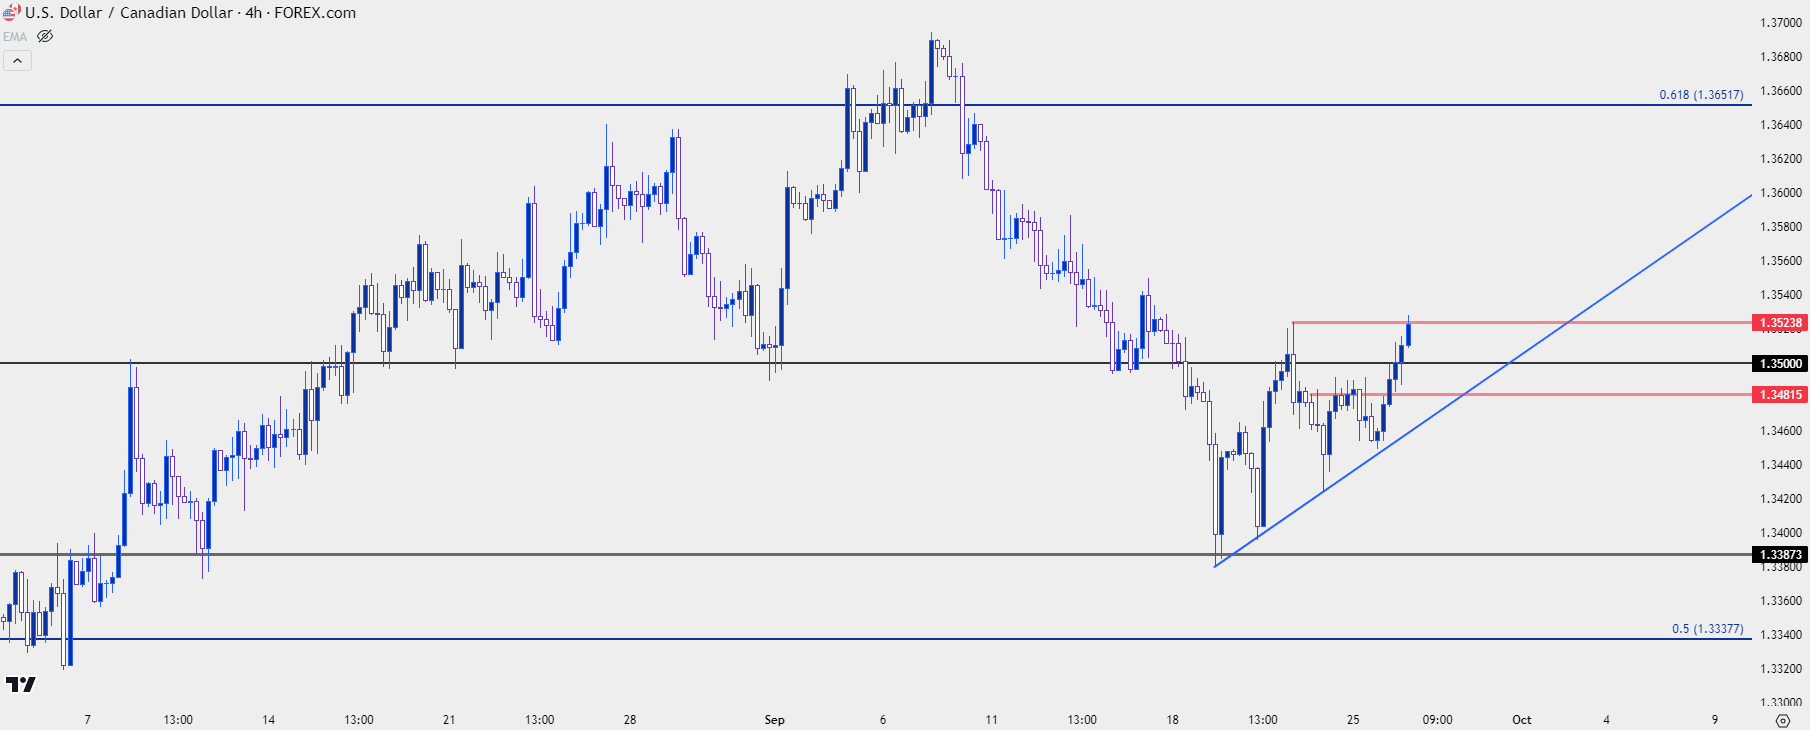
Chart prepared by James Stanley, USD/CAD on Tradingview
--- written by James Stanley, Senior Strategist


