Weekly Technical Trade Levels on USD Majors, Commodities & Stocks
- Technical setups we’re tracking into the open of the week
- Next Weekly Strategy Webinar: Monday, July 24 at 8:30am EST
- Review the latest Weekly Strategy Webinars on my YouTube playlist.
In this webinar we take an in-depth look at the technical trade levels for US Dollar (DXY), Euro (EUR/USD), British Pound (GBP/USD), Canadian Dollar (USD/CAD), Japanese Yen (USD/JPY), Gold (XAU/USD), Crude Oil (WTI), S&P 500 (SPX500), Nasdaq (NDX), Dow Jones (DJI), EUR/JPY and Bitcoin (BTC/USD). These are the levels that matter in the week ahead.
US Dollar Index Price Chart – DXY Daily

Chart Prepared by Michael Boutros, Sr. Technical Strategist; DXY on TradingView
A six-day plunge in the US Dollar Index was halted on Friday near the 2019 swing high at 99.67. A break of the yearly opening-range keeps the broader risk weighted to the downside while below the April low-day close at 101.58 for now. Initial resistance now eye at the median-line (currently ~100.50s) backed by the February lows at 101.82.
A break lower from here would expose the 61.8% Fibonacci retracement of the 2021 advance at 98.98. Note that the 25% parallel (blue) converges on this threshold over the next few weeks- look for a larger reaction there IF reached. Review my latest US Dollar Weekly Forecast for a closer look at these DXY technical trade levels.
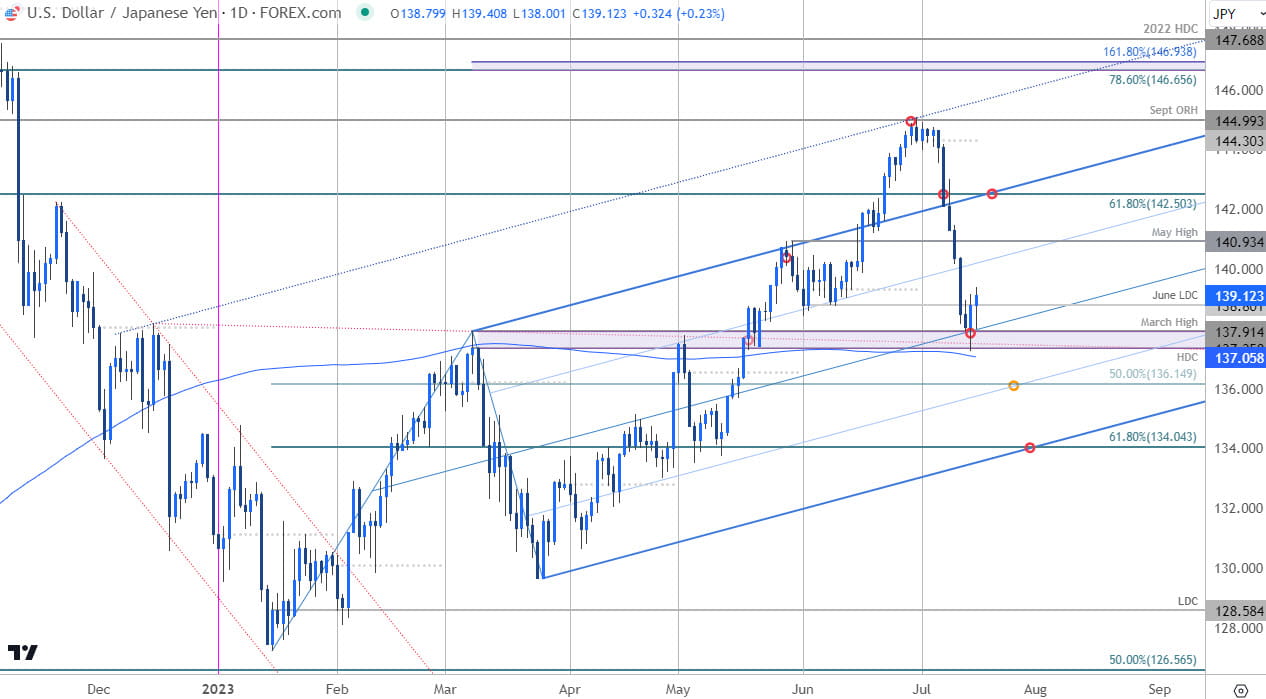
Japanese Yen Price Chart - USD/JPY Daily

Chart Prepared by Michael Boutros, Sr. Technical Strategist; USD/JPY on TradingView
Likewise, a six-day plunge in USD/JPY was halted at a key support confluence last week, “at 137.16/91- a region define by the 200-day moving average and the March high-day close / swing high.” While an outside-day reversal off the lows on Friday does highlight the threat for near-term price exhaustion, the wave count here allots for another stab into fresh low before a more meaningful reversal- stay nimble here.
Initial resistance stands at 139.90-140.23 backed by the May high at 140.91 (near-term bearish invalidation). A break lower from here would threaten another accelerated run towards 136.15 and the 61.8% retracement at 134.04. Review my latest Japanese Yen Short-term Outlook for a closer look at the near-term USD/JPY technical trade levels.
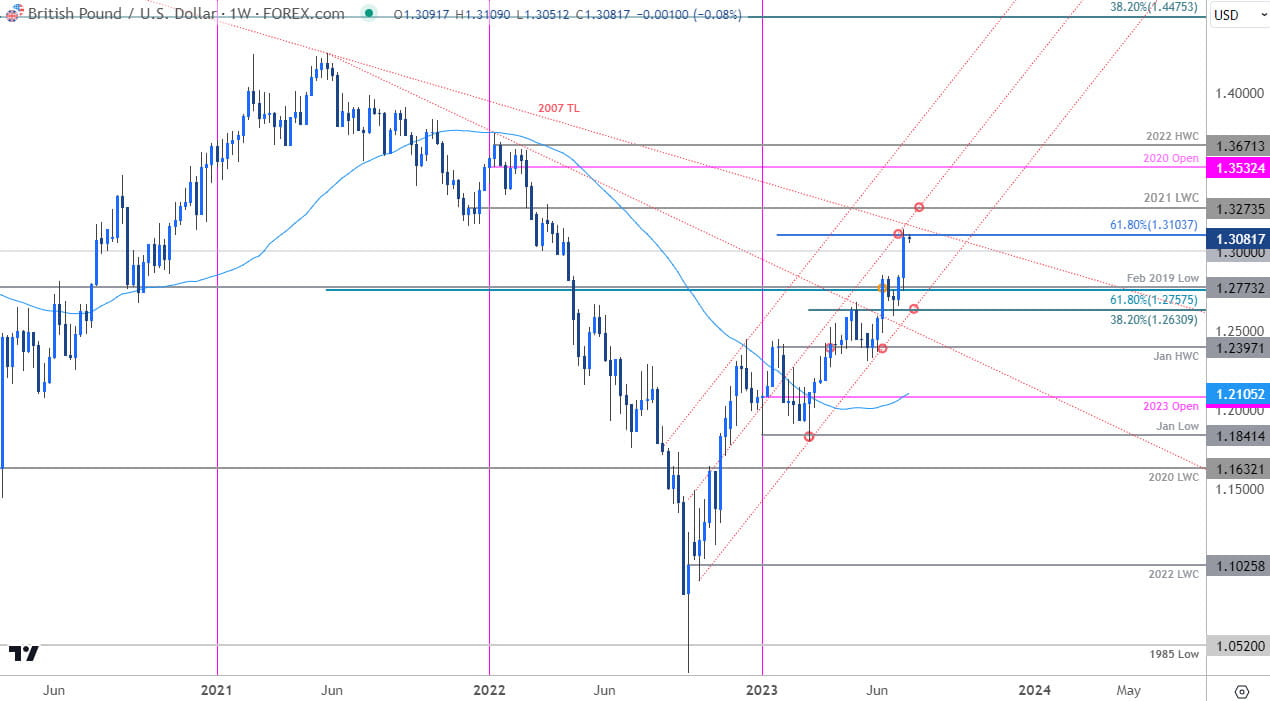
British Pound Price Chart – GBP/USD Weekly

Chart Prepared by Michael Boutros, Sr. Technical Strategist; GBP/USD on TradingView
The British Pound ripped into lateral resistance last week at the 61.8% extension of the 2022 advance around 1.3103. Note that confluent slope resistance can be seen just higher and leaves the immediate rally vulnerable while below this threshold.
Initial support eyed at 1.2757/73 with bullish invalidation now raised to the 38.2% retracement of the yearly range at 1.2630. A topside breach from here would expose the 2021 low-week close at 1.3274- ultimately, a breach / close above this level is needed to suggest a broader multi-year trend reversal is underway towards the 2020 yearly open at 1.3532. Review my latest British Pound Weekly Forecast for a closer look at the longer-term GBP/USD technical trade levels.
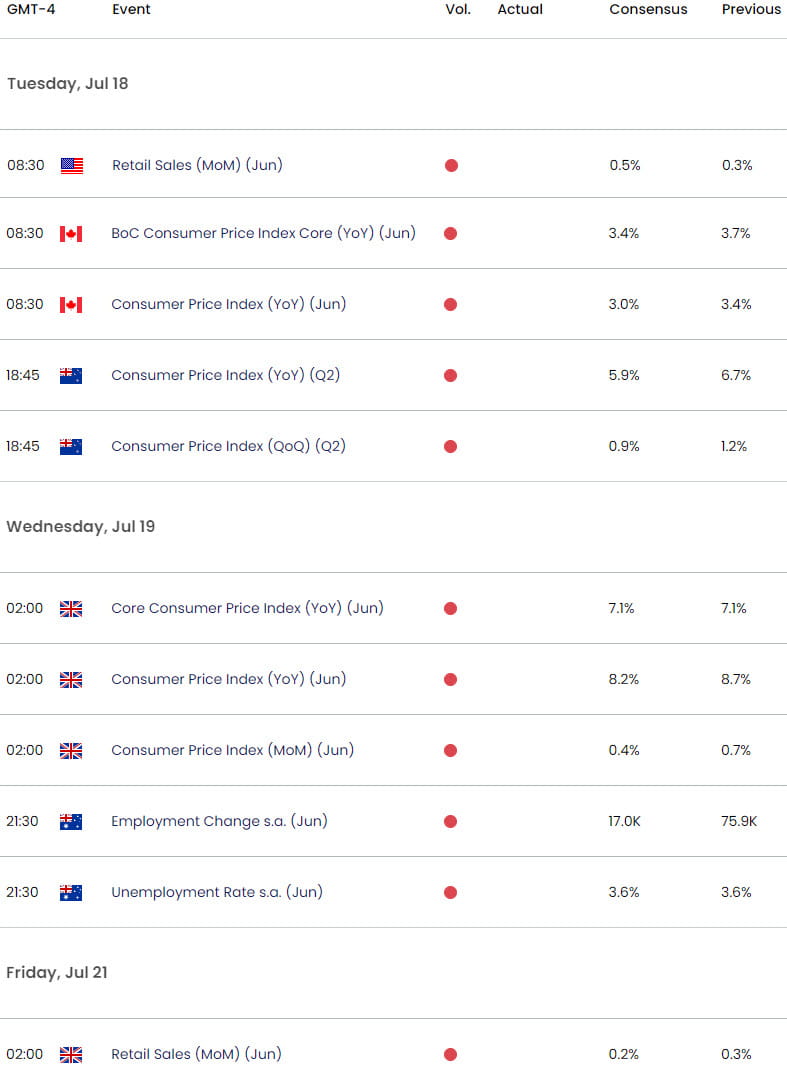
Economic Calendar – Key Data Releases

Economic Calendar - latest economic developments and upcoming event risk.
--- Written by Michael Boutros, Sr Technical Strategist with FOREX.com
Follow Michael on Twitter @MBForex


