Weekly Technical Trade Levels on USD Majors, Commodities & Stocks
- Technical setups we’re tracking into the close of the month / quarter
- Next Weekly Strategy Webinar: Monday, July 3 at 8:30am EST
- Review the latest Weekly Strategy Webinars on my YouTube playlist.
In this webinar we take an in-depth look at the technical trade levels for US Dollar (DXY), Euro (EUR/USD), Australian Dollar (AUD/USD), Canadian Dollar (USD/CAD), Japanese Yen (USD/JPY), EUR/JPY, British Pound (GBP/USD), GBP/JPY, Gold (XAU/USD), Silver (XAG/USD), Crude Oil (WTI), S&P 500 (SPX500), Nasdaq (NDX) and Dow Jones (DJI). These are the levels that matter heading into the close of June.
Canadian Dollar Price Chart – USD/CAD Weekly

Chart Prepared by Michael Boutros, Sr. Technical Strategist; USD/CAD on TradingView
The Canadian Dollar breakout is now approaching the first major support hurdle at a key technical confluence near 1.3107/10- a region defined by the 100% extensions (two-equal legs) off the 20223 & 2022 highs respectively. Look for a larger reaction there IF reached. A break of the yearly opening-range keeps the focus lower while below the 52-week moving average (currently ~1.34) with a close below this pivot zone needed to expose a run-on critical support at 1.2990-1.3023. I’ll publish an updated Canadian Dollar Short-term Outlook once we get further clarity on the near-term USD/CAD technical trade levels.
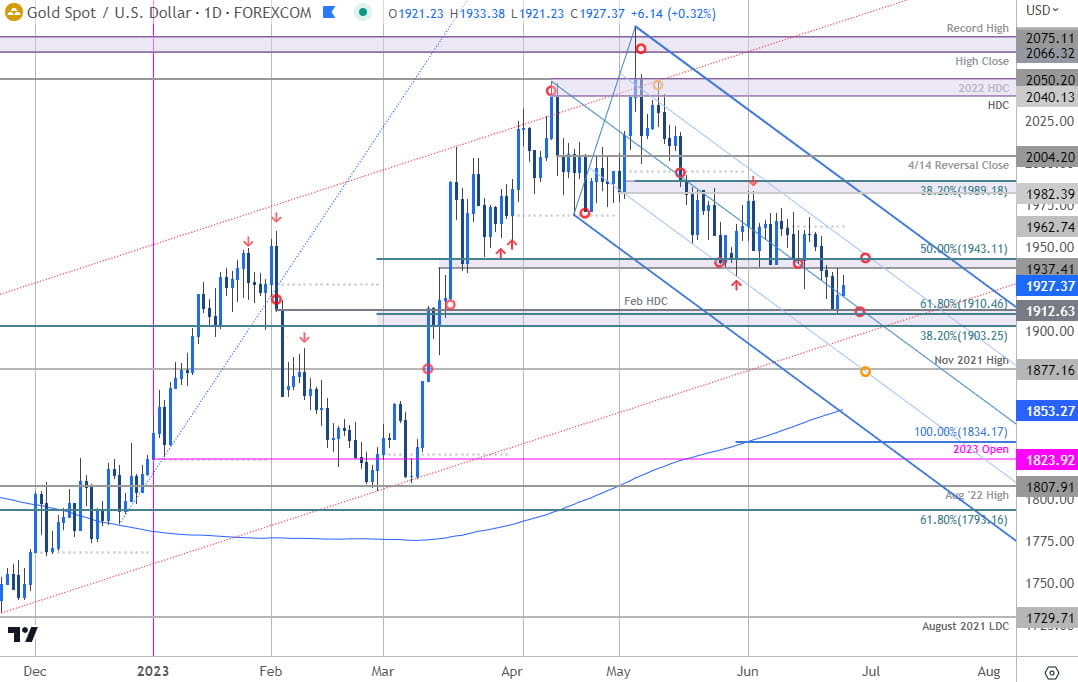
Gold Price Chart – XAU/USD Daily

Chart Prepared by Michael Boutros, Sr. Technical Strategist; XAU/USD on TradingView
A breakout of the monthly opening-range in gold has taken price into a key pivot zone here at 1903-1912- a region defined by the 38.2% retracement of the broader September rally, the 61.8% Fibonacci retracement of the yearly range and the February high-day reversal close. While the threat remains for one more probe, we’re on the lookout for an exhaustion low on a stretch towards the November channel line (red). Initial resistance now at 1943 backed by the monthly open at 1962. Review my latest Gold Price Forecast for a closer look at the longer-term XAU/USD technical trade levels.
--- Written by Michael Boutros, Sr Technical Strategist with FOREX.com
Follow Michael on Twitter @MBForex


