
US Dollar Talking Points:
- The US Dollar continues its bullish campaign with yet another fresh 2023 high. As I’ve been discussing in webinars, to this point much of the USD rally has been bulls responding to support. But now it appears as though we’re starting to see some stretch in price action to new highs as pullbacks have remained mild since last week’s FOMC rate decision.
- Markets are still expecting cuts next year, and much of the commotion in rates and the USD since last week’s Fed meeting is derived from the Fed forecasting two fewer cuts for next year. This puts more onus on incoming data, as continued strength in US data could further hit those hopes for rate cuts next year.
- I’ll be discussing these themes in-depth in the weekly webinar on Tuesday at 1PM ET. It’s free for all to register: Click here to register.
The US Dollar rally has continued to another fresh 2023 high. Price crossed the 105.88 level on Monday and the bullish trend has seemed to hasten since that breakout.
At the source of the move is US rates, with 10-year yields flying to fresh 16 year highs. And behind that move is last week’s FOMC rate decision in which the bank modified their forecast for rate cuts next year, reducing their expectation down to two from a prior four. In the week since that rate decision there’s been some sizable moves in markets, such as I had talked about in yesterday’s webinar.
On the rates front, treasury yields are showing near-parabolic like moves. The 10 year was finding support at 3.25% in April and we’re well-above 4.5% today. Today’s high has been 4.63% (as of this writing) and the low from last Wednesday was at 4.32%, making for a more than 30-basis point leap over a week which is a sizable jump in a very important asset class.
On the rate expectation front, markets are still highly expecting cuts next year and the probabilities around how many cuts have only changed slightly since last week. This highlights the fact that these themes of higher yields and a stronger USD could still see continuation, particularly if US data remains strong into the end of the week. Tomorrow brings a final read of Q2 GDP numbers, expected at 2.1%, but Friday brings two key data points with the release of PCE (the Fed’s preferred inflation gauge) and U of Michigan Consumer Sentiment.
Given where we are in the cycle, those sentiment reads have been key as markets are looking for leading indications of stress as the hikes from the past two years filter through the system. But inflation remains highly important, as well, so both of those data points will likely see considerable focus from market participants.
On the price front, the USD breakout has shown considerable strength. It could be a challenge to chase as the currency is overbought from a few different vantage points, but there’s been a similar case that can be made on the DXY for the past month, and a market could theoretically get even more overbought.
Last week showed support at prior resistance, around the 104.70 level. The 105.88 prior high was set in March and that showed short-term support yesterday; but that could be an item of consideration for those looking to work with pullbacks.
US Dollar - DXY Daily Price Chart (indicative only, not available on Forex.com platforms)
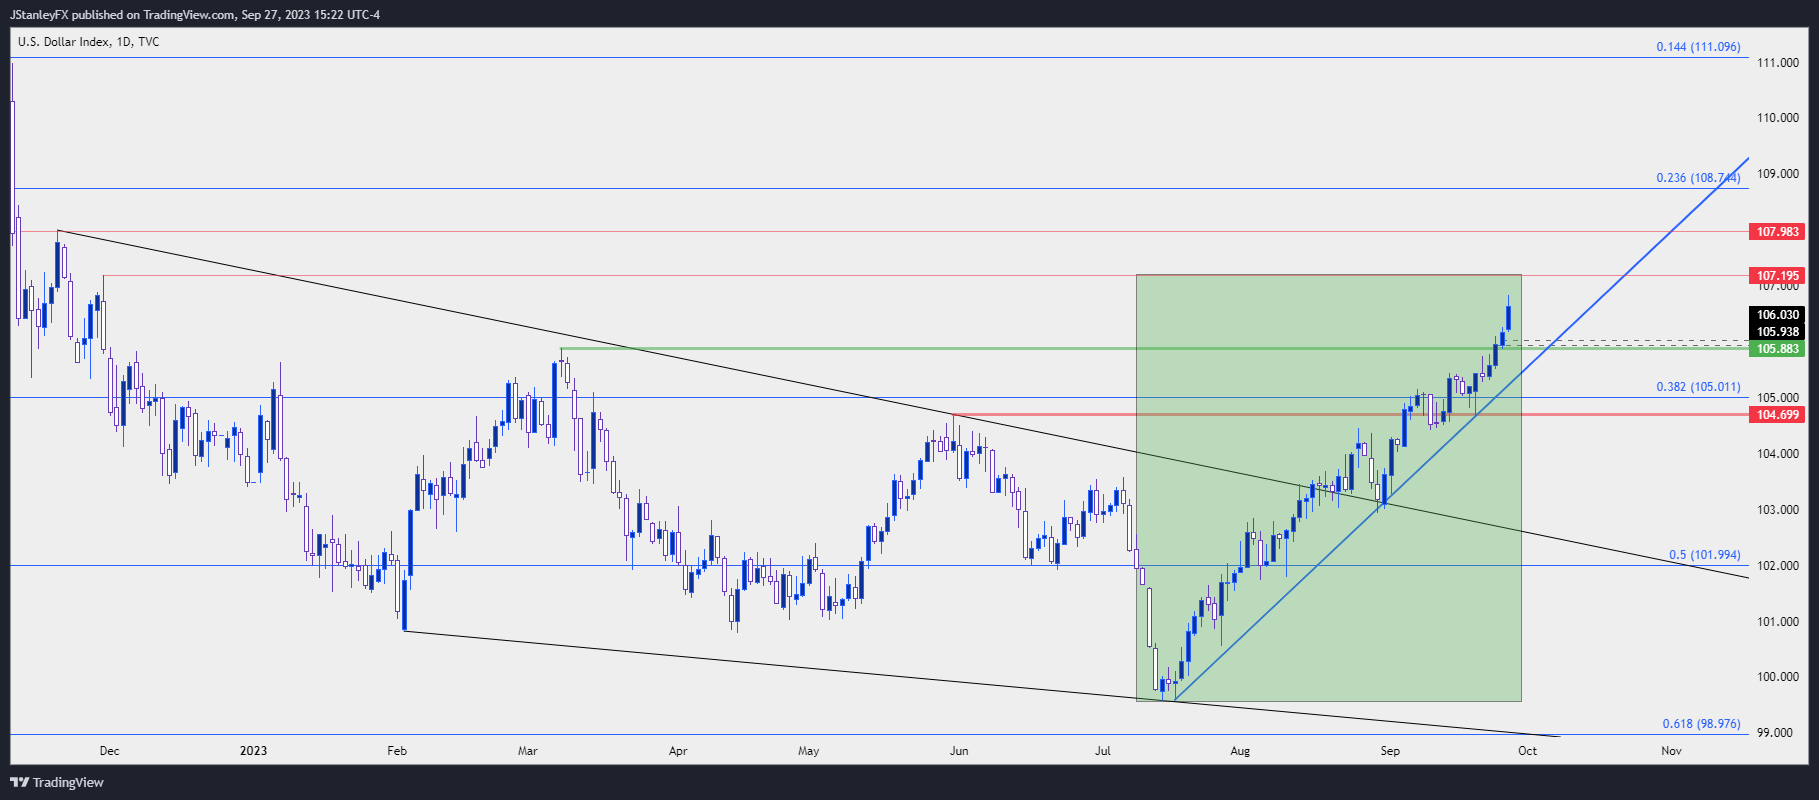
Chart prepared by James Stanley; data derived from Tradingview
EUR/USD 1.0500
The move in EUR/USD has been a large source of strength in the DXY move. The week before the FOMC meeting we heard from the ECB when they hiked rates; but there was also the thought that it may be their last such move of this cycle and in response the pair and the Euro sold off in the aftermath of that rate hike.
Since then, the pair has continued to trade lower and today brought another large continuation element with the pair re-testing the 1.0500 psychological level since the very first week of the year. That was a key test, as it took place on the morning of Friday, January 6th. At the time, there was consternation as to whether the Fed was nearing complete for their rate hikes, and a dismal Services PMI print released that morning helped to push the US Dollar down and EUR/USD higher. That was the lone test below 1.0500 so far this year in EUR/USD.
That level was penetrated intra-day, but bulls have made a push back above that price, which keeps the door open for pullback. If sellers remain aggressive there’s short-term resistance potential around 1.0536, which was the swing-low in March. And if that level isn’t enticing enough for trend continuation, the next resistance could be sought around 1.0611, which is a Fibonacci level related to the 1.1275 (the 2023 high) and 1.0943 (the current monthly high).
Notably, 1.0611 was a mere pause point in the sell-off which indicates just how heavy sellers have been hitting this move.
EUR/USD Daily Chart
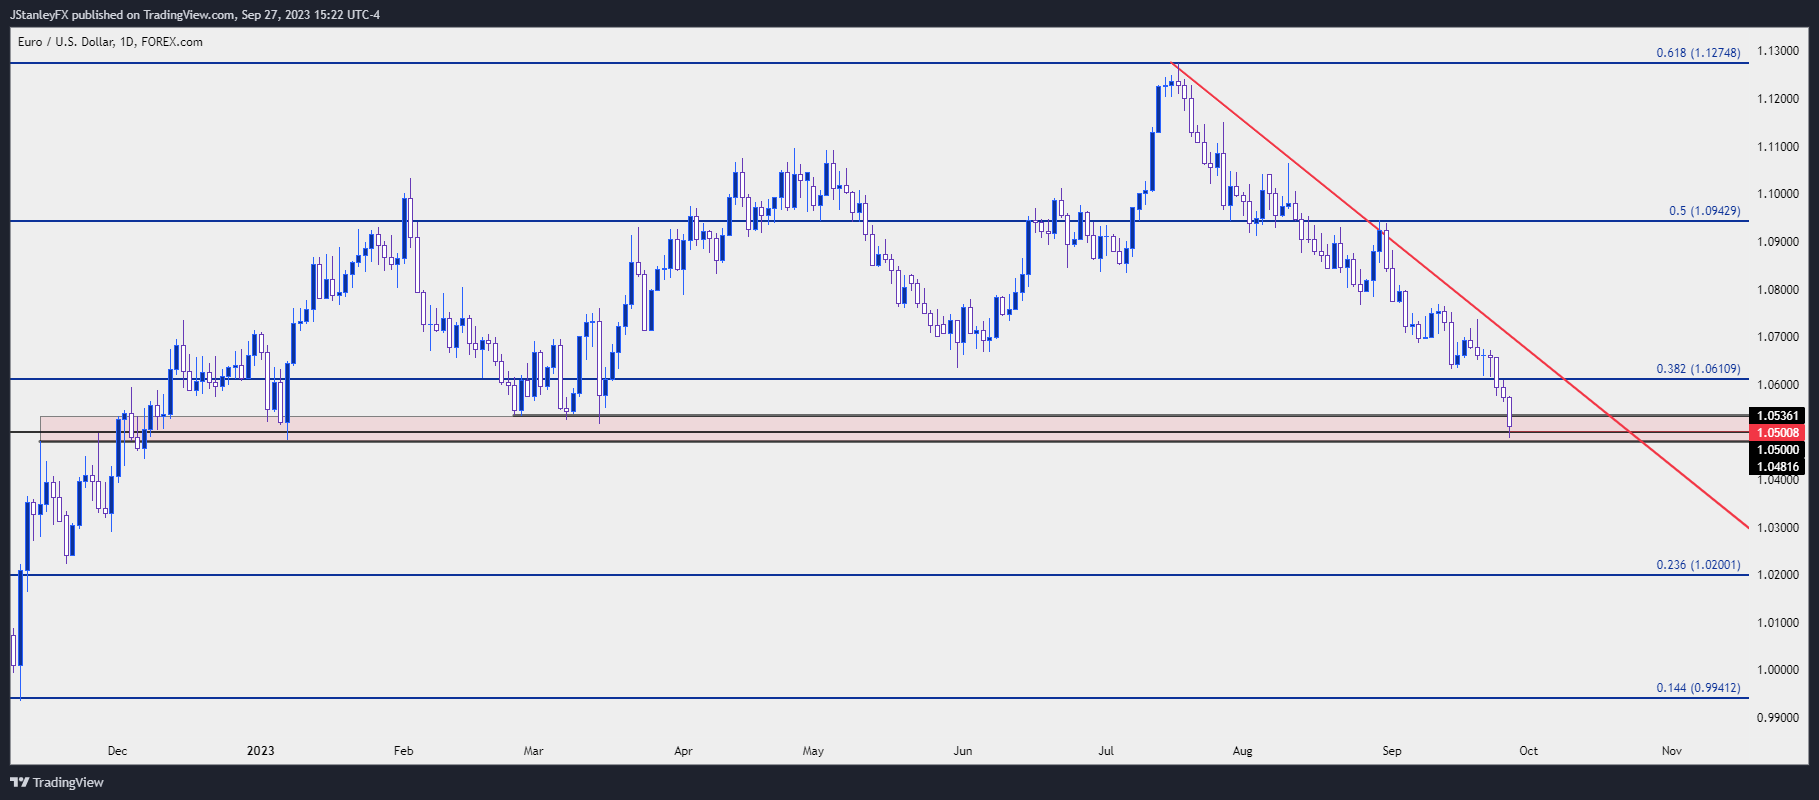
Chart prepared by James Stanley, EUR/USD on Tradingview
Gold
Gold price action has changed considerably from last week. Leading into the Fed Gold had retained some element of strength even as the US Dollar was breaking out. That is no longer the case and gold prices have been falling aggressively over the past week.
Of interest is the fact that both the US Dollar and US Treasury yields are well beyond their March inflection points. Gold, however, is still far away from that swing low in March, which was helped along by the banking crisis in the US hitting rate hike odds. But now that the USD has retraced the entirety of that loss the big question is whether gold will continue to play catch-up.
I’m tracking next support on gold around the 1850 level, after which the March lows come into view around 1805-1810. On the resistance side of the coin, prior support around 1903 can remain of interest, and perhaps even 1885 depending on how aggressively sellers remain to be after today’s break.
Gold (XAU/USD) Daily Price Chart
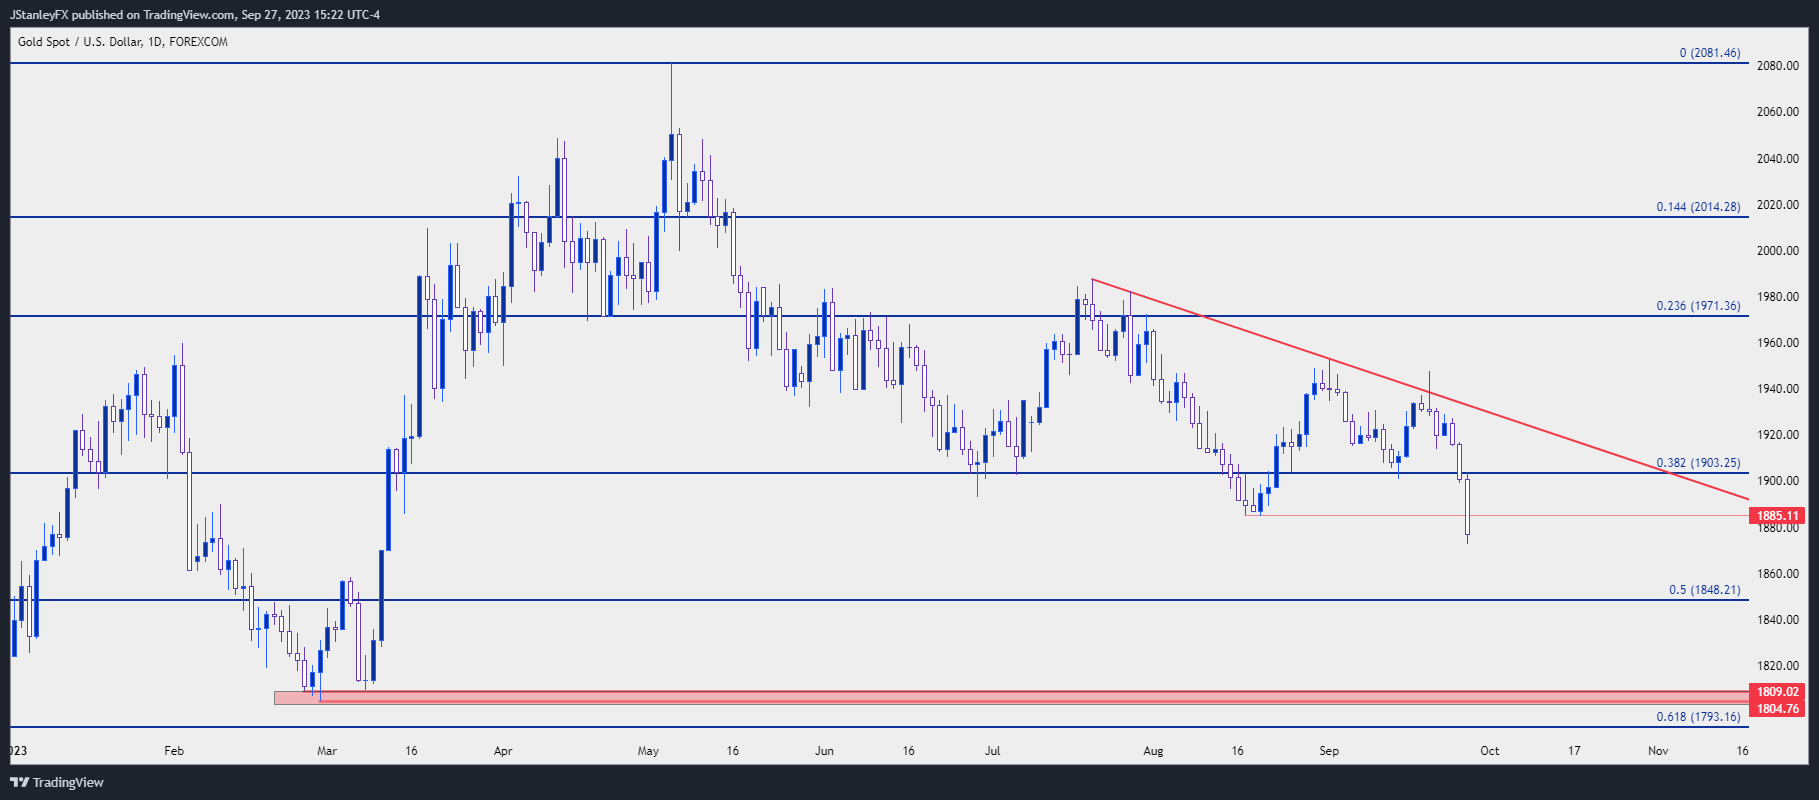
Chart prepared by James Stanley, Gold on Tradingview
GBP/USD
While the ECB hiked with markets thinking it may be their last, the Bank of England avoided hiking at all even with inflation printing above 6% the day before their rate decision last week. This has not been of much help to GBP which continues to fall and there’s been a minimal reaction to supports thus far.
For resistance, there could be some interest around 1.2300, which is confluent with the 50% mark of the 2021-2022 sell-off. That price had come into play last Thursday, the day after the Fed and the day of BoE, as bulls tried to show a support response that ended up falling flat. For next support, the 1.2000 handle remains of interest, especially if the breakdown continues with velocity. The pair will likely be oversold from a few different vantage points in that scenario.
GBP/USD Daily Price Chart
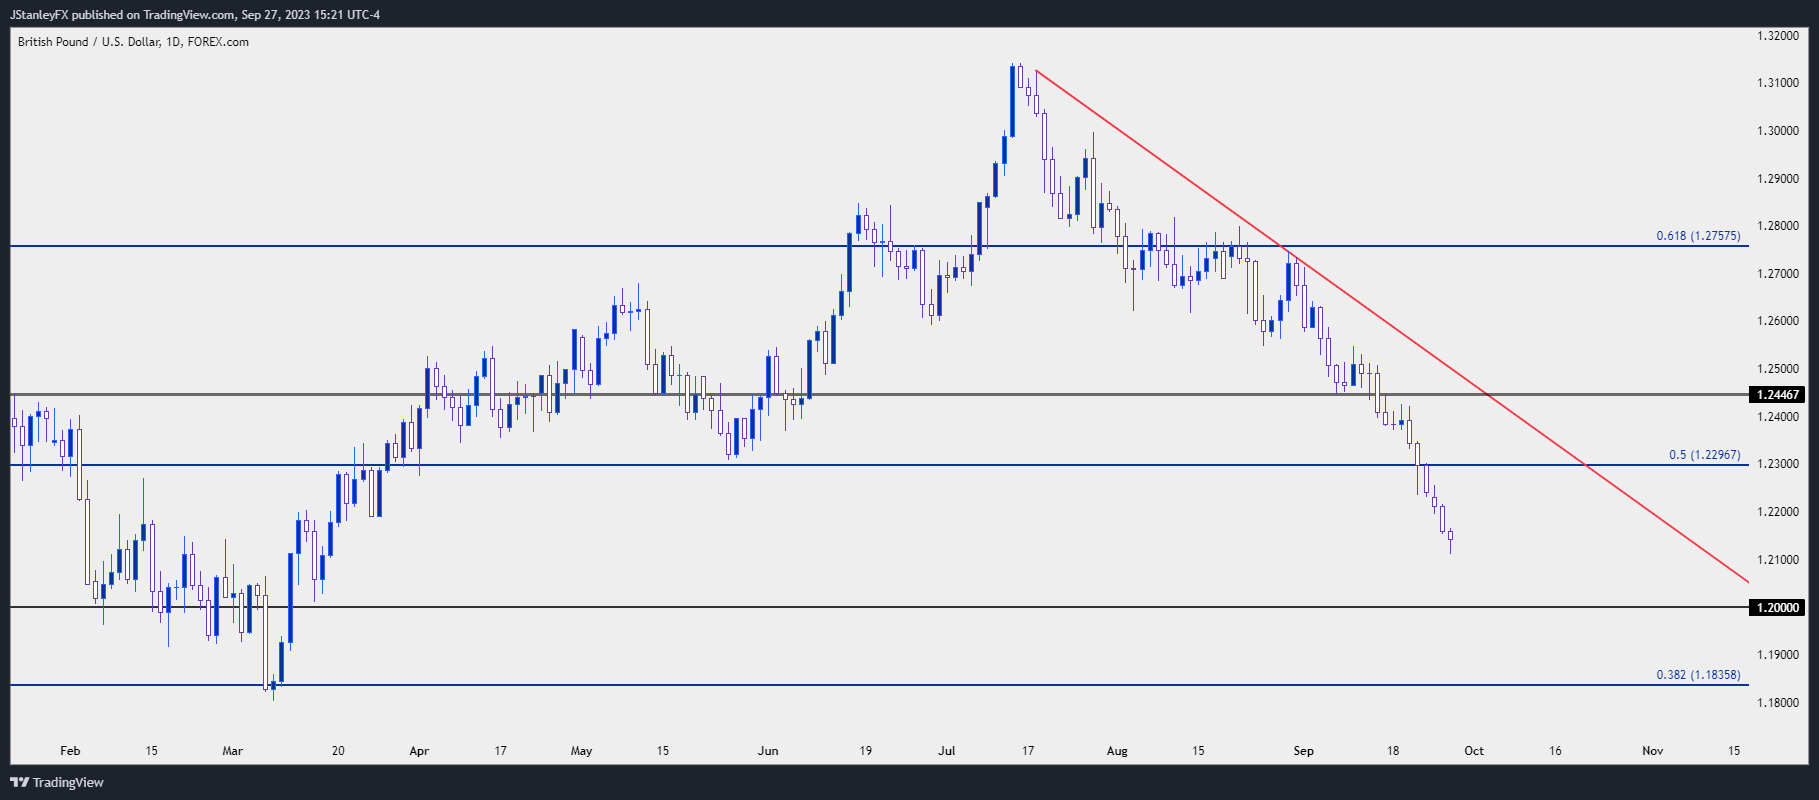
Chart prepared by James Stanley, GBP/USD on Tradingview
USD/CAD
USD/CAD is one of the few major FX pairs that’s not currently at a significant high or low. The pair was in a bearish trend leading into FOMC last week, with a support bounce showing at prior resistance of 1.3387. That led to another test above the 1.3500 level on Thursday of last week, but bulls were thwarted at the big figure.
I had looked into the matter yesterday to highlight a short-term ascending triangle formation. Price has since put in a bullish breakout but, similarly, bulls haven’t been able to run for long and price has pulled back to 1.3500 support.
This could keep the door open for topside scenarios. But also of consideration is the fact that USD/CAD seems like an outlier as many other pairs, such as AUD/USD or EUR/USD are at significant highs or lows while USD/CAD is not. This deductively highlights that the short-side of USD/CAD may be one of the more attractive scenarios for situations of USD-weakness, if we do, in fact, see data come in below expectation in the latter-portion of this week.
But, as of this point, the four-hour chart below retains a bullish tint on the basis of holding higher-low support at 1.3500 after the breakout attempt from the ascending triangle.
USD/CAD Four-Hour Price Chart
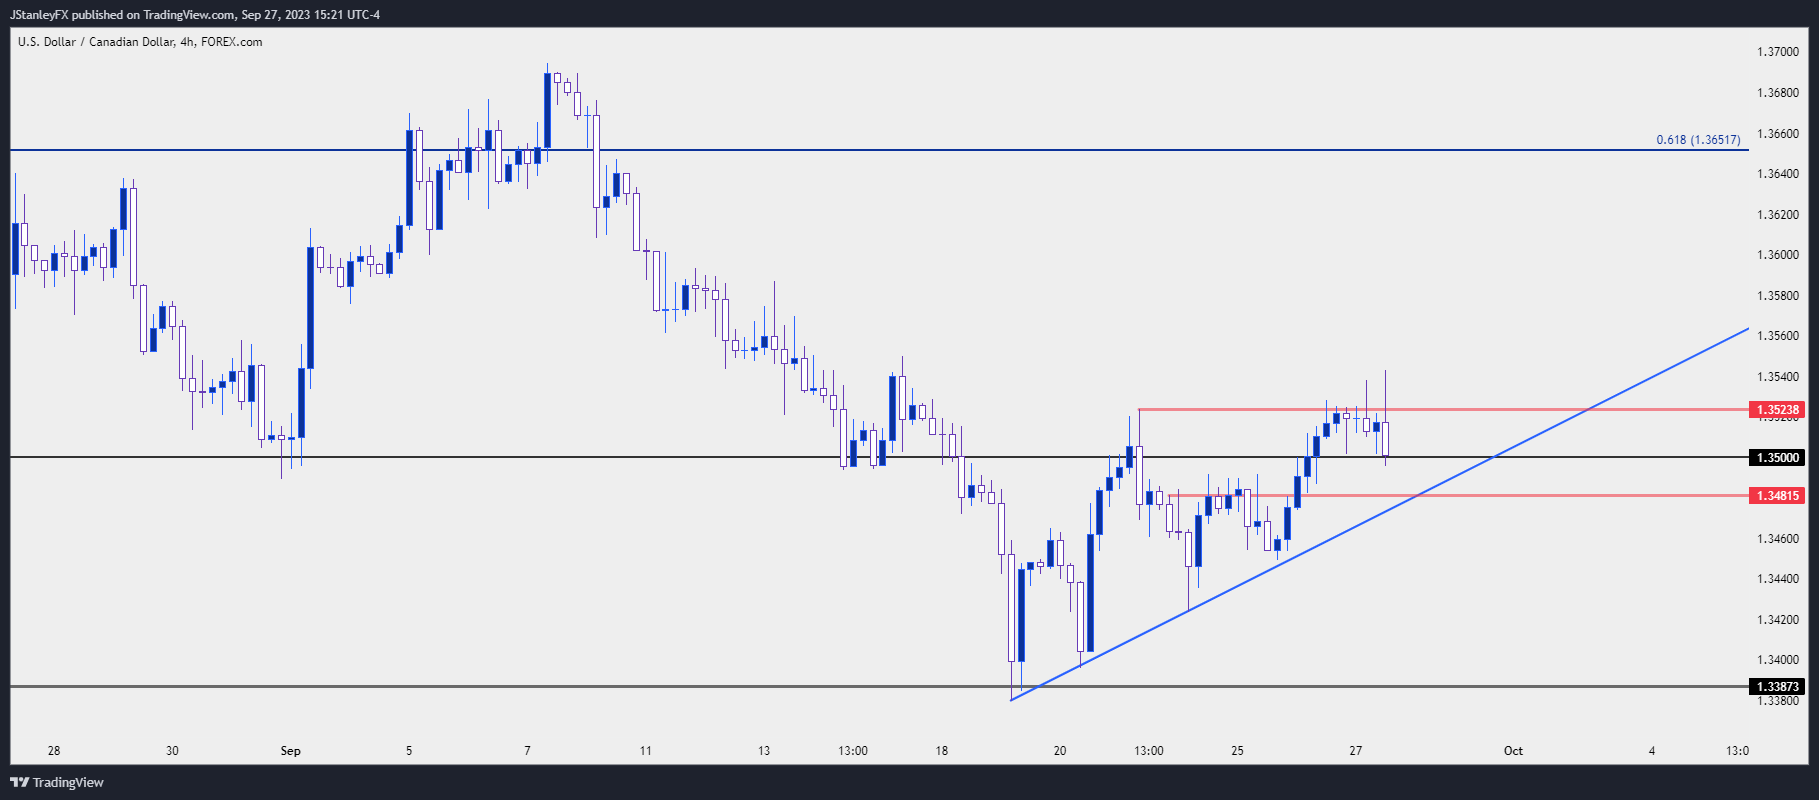
Chart prepared by James Stanley, USD/CAD on Tradingview
USD/JPY
This is a tough one…
We’re inching closer to the same 150 value that brought out the intervention hammer last year. And in retrospect that intervention ended up leading to a move of 2,500 pips in the pair, so it looks as though it was successful and that this might be a level that the Bank of Japan, or at least the Ministry of Finance, wants to defend.
We’ve even heard some threats of intervention when the pair was working in the 147’s a couple of weeks ago. And now USD/JPY is more than a couple hundred pips higher.
As I’ve been saying in webinars this feels more and more like a game of cat and mouse and given history, 150 remains a line in the sand. But to date we haven’t seen any interventions, so the question remains as to whether we’ll see action, or not.
One factor to consider are the broader trends that took over in Q4 of last year. The USD topped in September, and USD/JPY in October. But it was the support break in November that sent USD/JPY spiraling-lower, and that was on the back of a softer inflation print.
So, the BoJ and MoF really had impeccable timing for that intervention last year. And now may not present the same backdrop as the USD has been in an aggressively bullish move as Treasury rates shoot higher. If the BoJ does intervene at the demand of the MoF, with the prevailing headwinds that we have now, there may not be a similar story of success as what was seen last year.
What could open up matters a bit is a pullback, and perhaps there could be some help if PCE comes out below expectation on Friday. In that event, the carry on the pair remains decisively tilted to the long side and that could present higher-low opportunity for trend traders.
USD/JPY Daily Price Chart
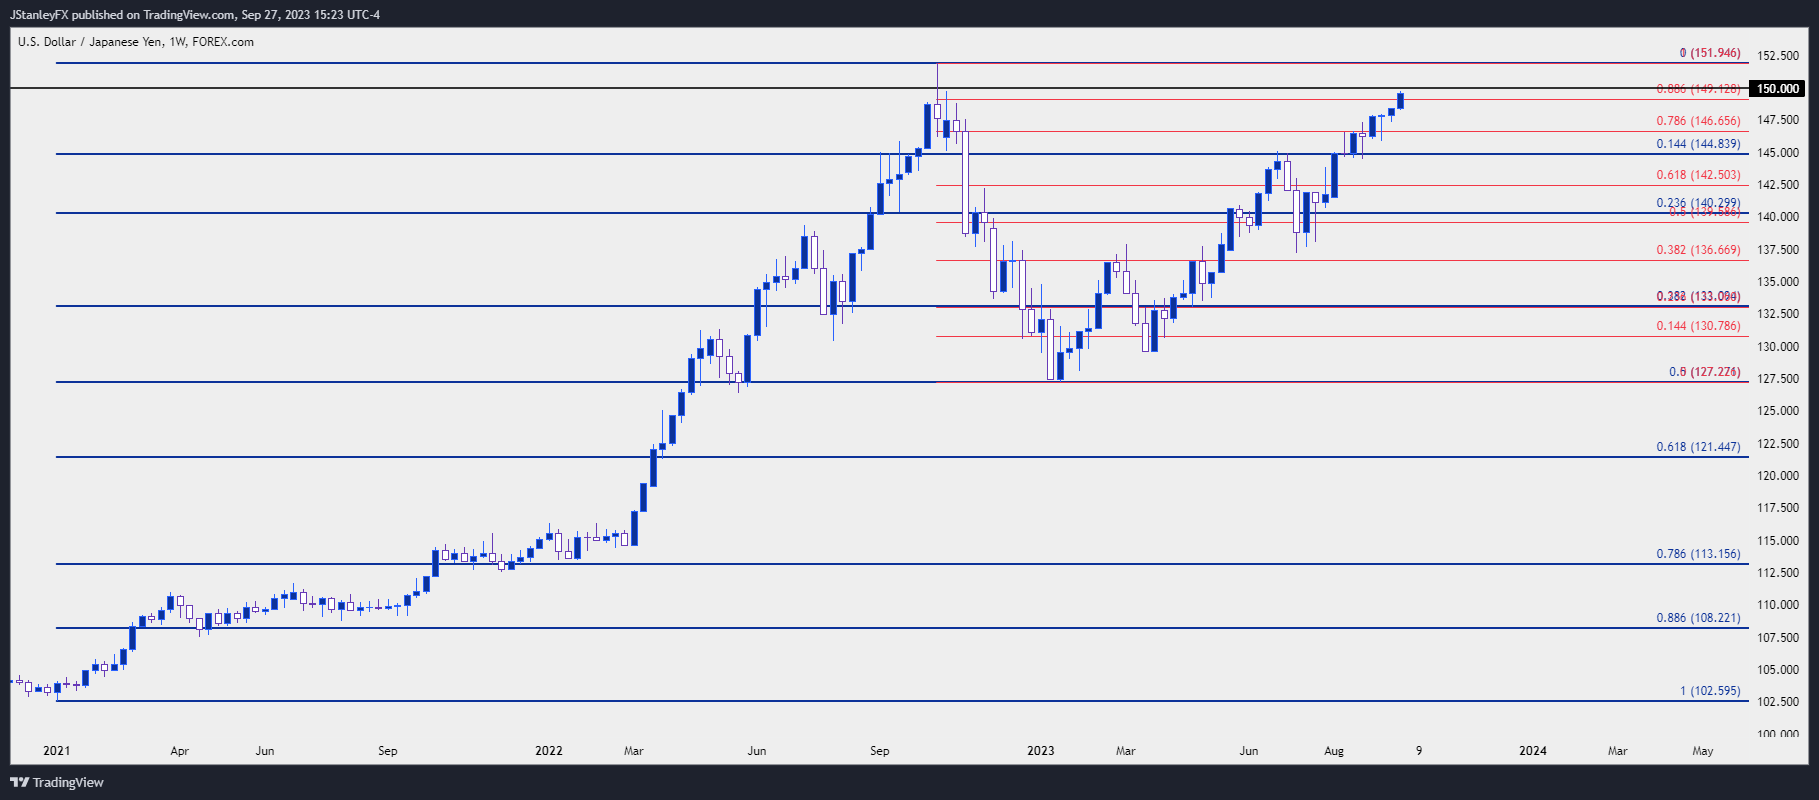
Chart prepared by James Stanley, USD/JPY on Tradingview
--- written by James Stanley, Senior Strategist


