US Dollar Index Technical Forecast: DXY Weekly Trade Levels
- US Dollar trades back into objective yearly open
- USD consolidation within 2023 opening-range poised for breakout into Q3
- DXY resistance 103.00/49, 104, 104.63– support 101.90s, 101.29 (critical), 100
The US Dollar is virtually unchanged this week as the recent recovery faltered into a major pivot zone around the 2023 yearly open. The outlook heading into July now hinges on a breakout of the yearly consolidation pattern and battle-lines are clear heading into Q3. These are the updated targets and invalidation levels that matter on the DXY weekly technical chart.
Review my latest Weekly Strategy Webinar for an in-depth breakdown of this USD setup and more. Join live on Monday’s at 8:30am EST.
US Dollar Index Price Chart – DXY Weekly

Chart Prepared by Michael Boutros, Sr. Technical Strategist; DXY on TradingView
Technical Outlook: In my last US Dollar Index Technical Forecast we noted that the DXY, “rebound may be vulnerable here just below the yearly high-week close.” The Dollar registered an intraweek high just pips above 104.63 before plunging more than 2.6% with the index paring a portion of that decline for the past two-weeks.
Despite a yearly trading range of more than 4.8%, DXY is now trading within 0.5% of the yearly open as price continues to contract within the objective 2023 opening-range. Heading into Q3, the focus is on a breakout of this consolidation formation just above broader uptrend support.
Initial resistance steady at 103.49 backed by the March consolidation slope (currently ~104). Ultimately a breach / close above the high-week close at 104.63 is needed to fuel an attempt on key resistance at 105.56-106.15- a region defined by the 52-week moving average, the August low-week close and the 38.2% Fibonacci retracement of the 2022 decline. Look for a larger reaction there IF reached.
Initial slope support rests near 101.90s with a weekly close below the 2022 May lows at 101.29 needed to validate a breakout of the objective yearly opening-range. Such a scenario would threaten a bout of accelerated losses towards 100 and the 61.8% Fibonacci retracement of the 2021 advance at 98.98.
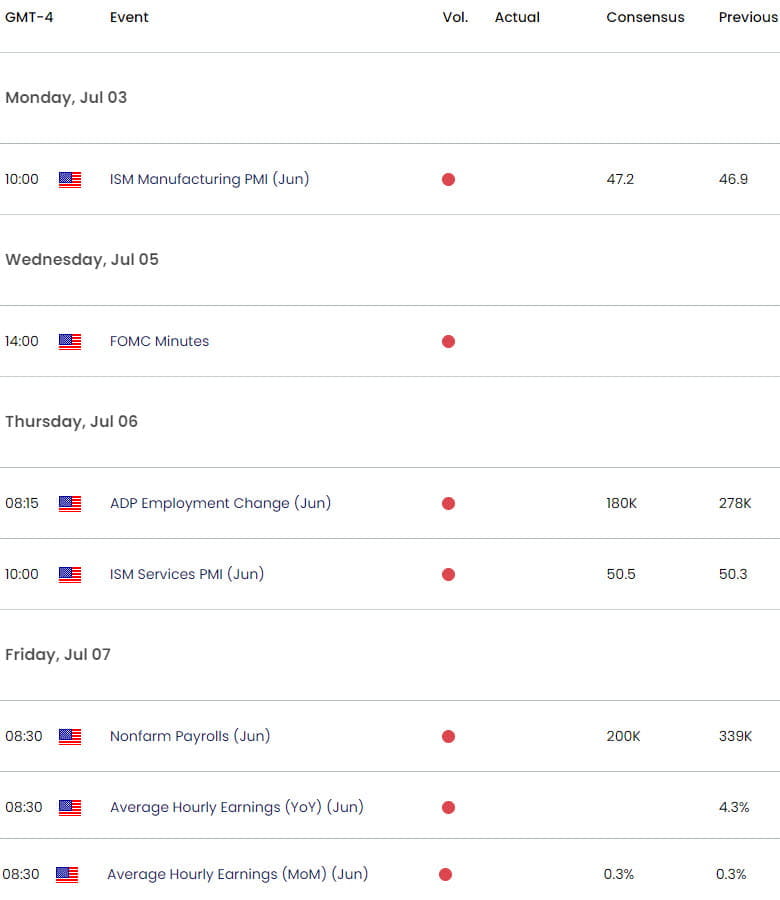
Bottom line: The US Dollar is poised for a breakout of the yearly consolidation range heading into July / Q3 open. From a trading standpoint, losses should be limited to 102 IF price is heading higher on this stretch with a close above 104.63 needed to validate a breakout. Stay nimble into the start of the month with a shortened holiday-week culminating on Friday with the release of US Non-Farm Payrolls- expect some volatility here. Review my latest US Dollar Short-term Outlook for a closer look at the near-term DXY technical trade levels.
Key US Economic Data Releases

Economic Calendar - latest economic developments and upcoming event risk.
Active Weekly Technical Charts
- Australian Dollar (AUD/USD)
- Crude Oil (WTI)
- Gold (XAU/USD)
- Canadian Dollar (USD/CAD)
- Euro (EUR/USD)
- Japanese Yen (USD/JPY)
- British Pound (GBP/USD)
--- Written by Michael Boutros, Sr Technical Strategist with FOREX.com
Follow Michael on Twitter @MBForex


