
US Dollar Talking Points:
- The bullish run in the US Dollar continued through the first three days of the week, with some resistance finally showing around the 104.50 level on DXY on Wednesday.
- So far, the pullback from that has held support at prior resistance around the 104.00 handle, which was the first support zone looked at in yesterday’s article. The big question for continuation drives back to the DXY’s largest constituent of the Euro, as EUR/USD is extending its bounce from the confluent support looked at in Tuesday’s webinar.
- For next week we’ll get some key data on the USD with Core PCE on Thursday and NFP on Friday. I look at the US Dollar from multiple vantage points in the weekly webinars on Tuesday, and you’re welcome to join the next one: Click here for registration information.
The US Dollar’s Q4 breakout continued to run through the past week and at this point, the currency has already taken out more than 61.8% of the 2024 bearish trend. That sell-off took five full months to run, with the final month of that move showing significant stall in September, and already more than 61.8% was retraced through the first three days of last week.
As a matter of fact, that 61.8% retracement remains of issue and at this point, it’s helping to set support on Friday ahead of the weekly close. It was a level looked at in the Thursday article on the USD, confluent with the 104.00 level and at this point, it’s holding bears at bay from a larger pullback.
There is additional context for support below that, with the 200-day moving average plotted at 103.82 and given the resistance that had shown there previously, there’s also a case of support potential from prior resistance.
US Dollar Daily Price Chart
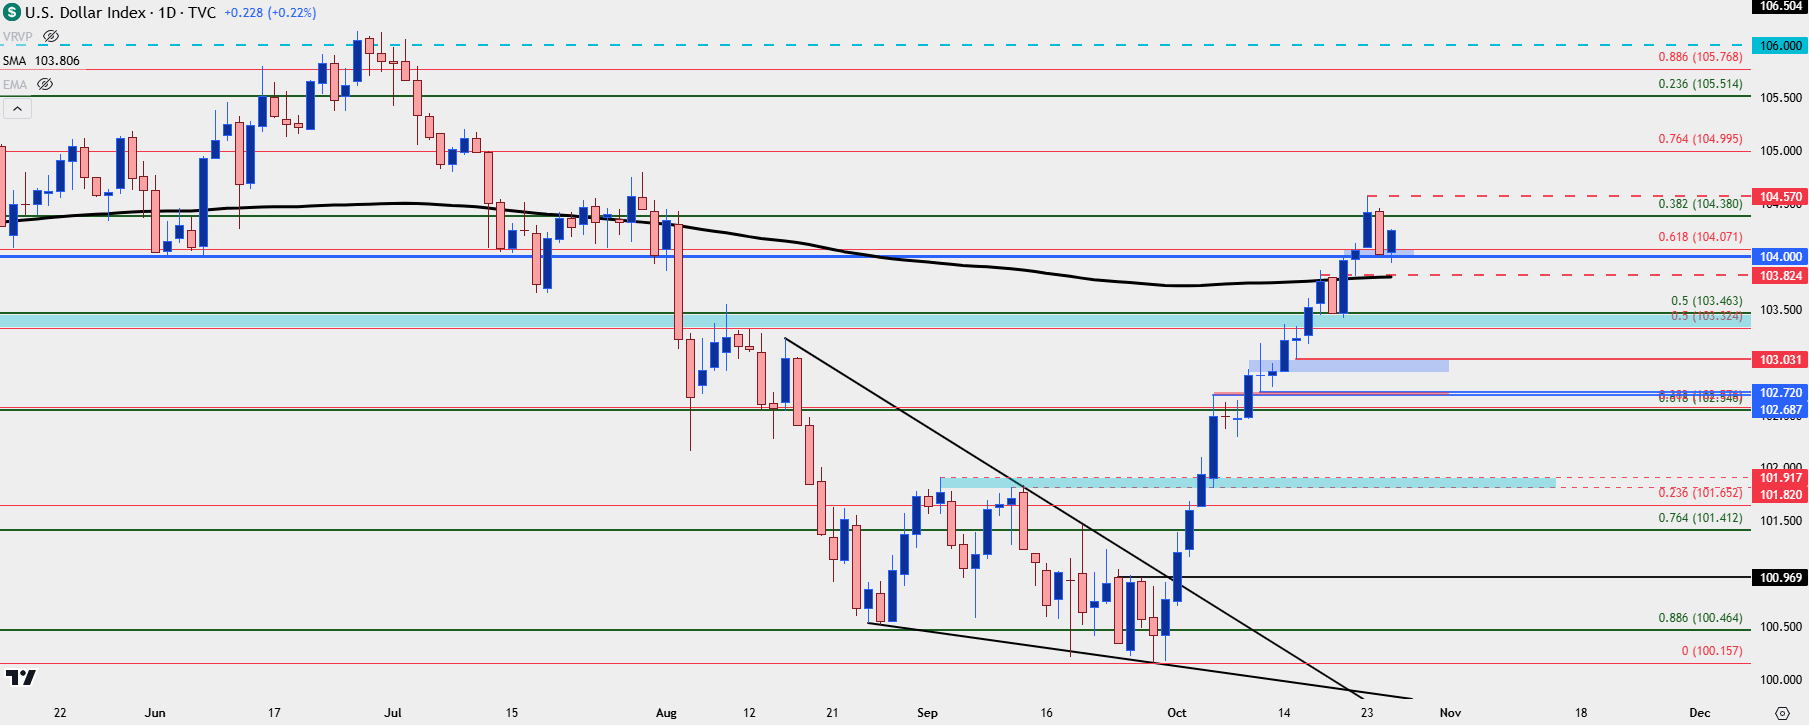 Chart prepared by James Stanley; data derived from Tradingview
US Dollar Weekly Chart
Last week saw a similar style of retracement arrive on Friday and that left an extended upper wick on the DXY daily bar. With another showing this week, it further highlights how heavy the trend has become as a rather one-sided move has priced-in.
And, as always with DXY, considering that it is merely a composite of underlying currencies, it’s worthwhile to look at those constituents when analyzing the currency. The largest allocation of DXY is the Euro and the pullback from resistance in DXY mirrors the bounce in EUR/USD quite well. I’ll get deeper into the EUR/USD move below but the takeaway from the weekly chart below is that given two consecutive late-week pullbacks, there could be more motivation for bulls to take profit through early trade next week.
US Dollar Weekly Price Chart
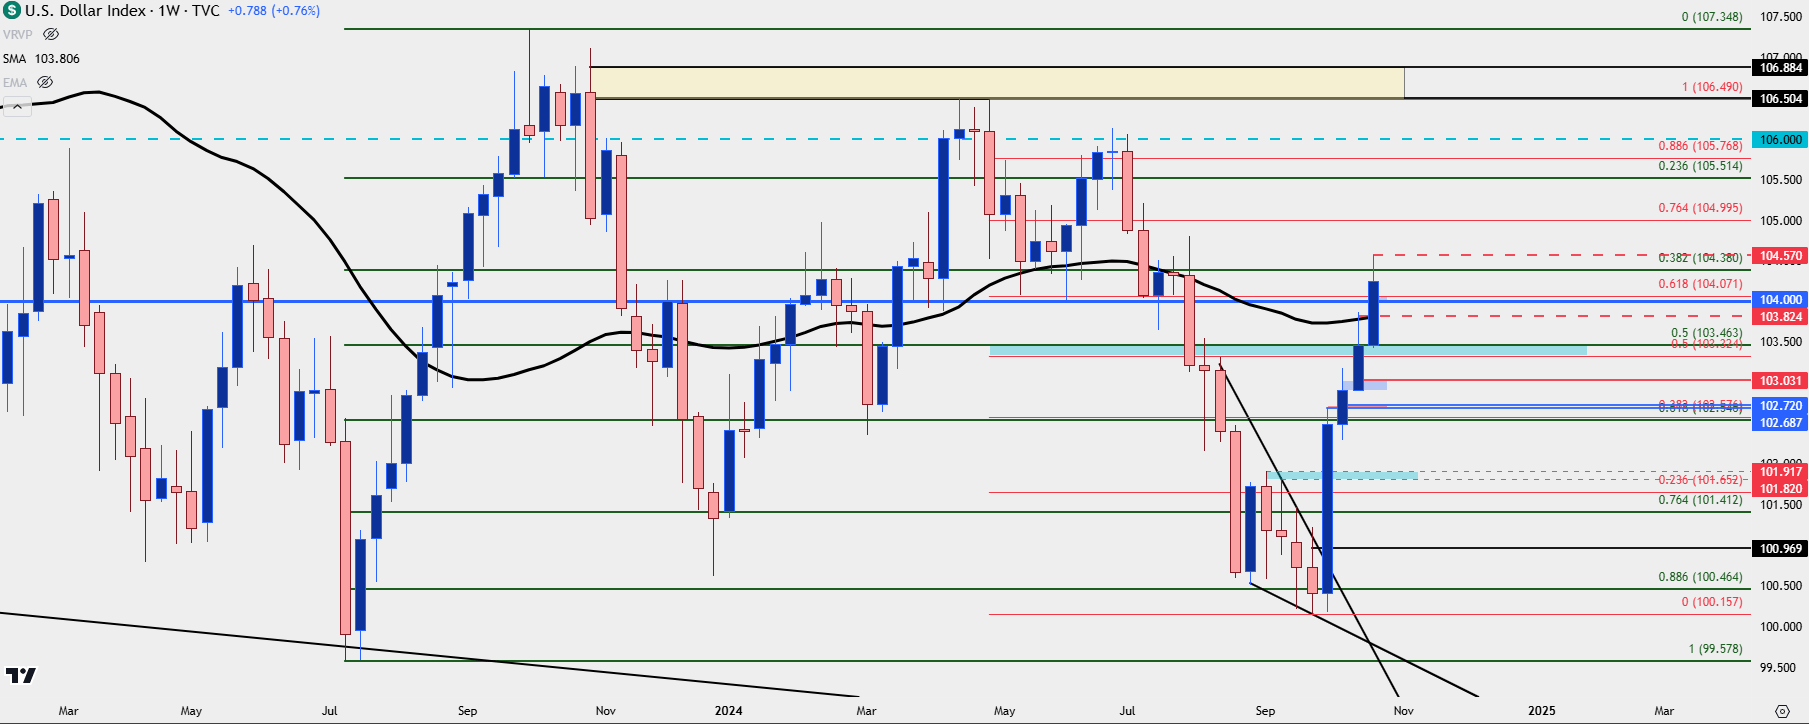 Chart prepared by James Stanley; data derived from Tradingview
EUR/USD
EUR/USD rode a spectacular bearish trend through the first three days of last week and that tallied 17 red days out of the past 19. That’s some pretty severe re-pricing and as I shared in the Tuesday webinar, that’s not exactly a healthy trend. The true value of a trend can be graded not when at trend-side extremes, but rather after counter-trend pullbacks at which point we can get a better gauge for how aggressive buyers (or, sellers in this case) remain to be.
In the webinar on Tuesday I looked at a confluent spot on the chart at 1.0765. That’s a Fibonacci level as it marks 38.2% of last year’s sell-off. But, it’s also confluent with a trendline as drawn from last year’s low.
That contributed to a sizable bounce on Thursday that stretched into early Friday trade which has played a role in that upper wick on the DXY weekly chart looked at above.
EUR/USD Daily Price Chart
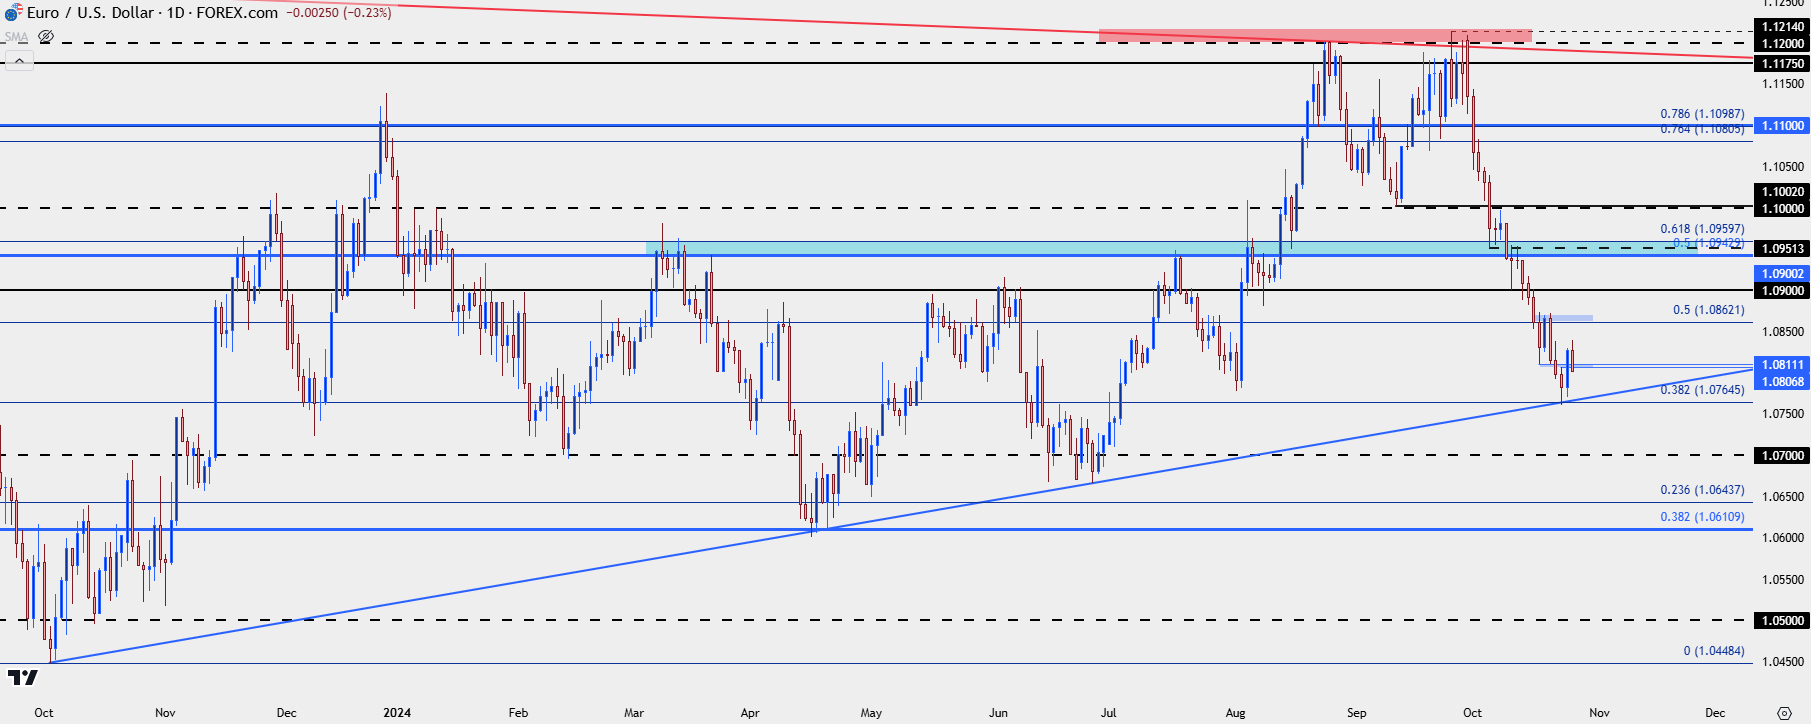 Chart prepared by James Stanley, EUR/USD on Tradingview
EUR/USD Bigger Picture
From the weekly chart, the bigger picture highlights a longer-term range that remains in-place. I was talking about this in late September as the 1.1200 handle had showed up to halt bulls in their tracks. And now with price making a strong swing-lower in the first month of Q4, that range very much applies.
Timing, however, could remain of challenge especially with how quickly the bearish move has priced-in. Last week saw multiple ECB members sounding a bit less-dovish than they had a week before. And to be sure, a rapidly declining currency value is likely something that they would want to avoid as that would serve to push against inflation, which could make future rate cuts designed to spur growth more of a challenge.
The bigger question here now draws back to the daily chart looked at above, and when or whether sellers re-enter to defend lower-high resistance. The 200-day moving average is of interest for such, with the 1.0900 and then 1.0943-1.0960 zones sitting overhead.
EUR/USD Weekly Price Chart
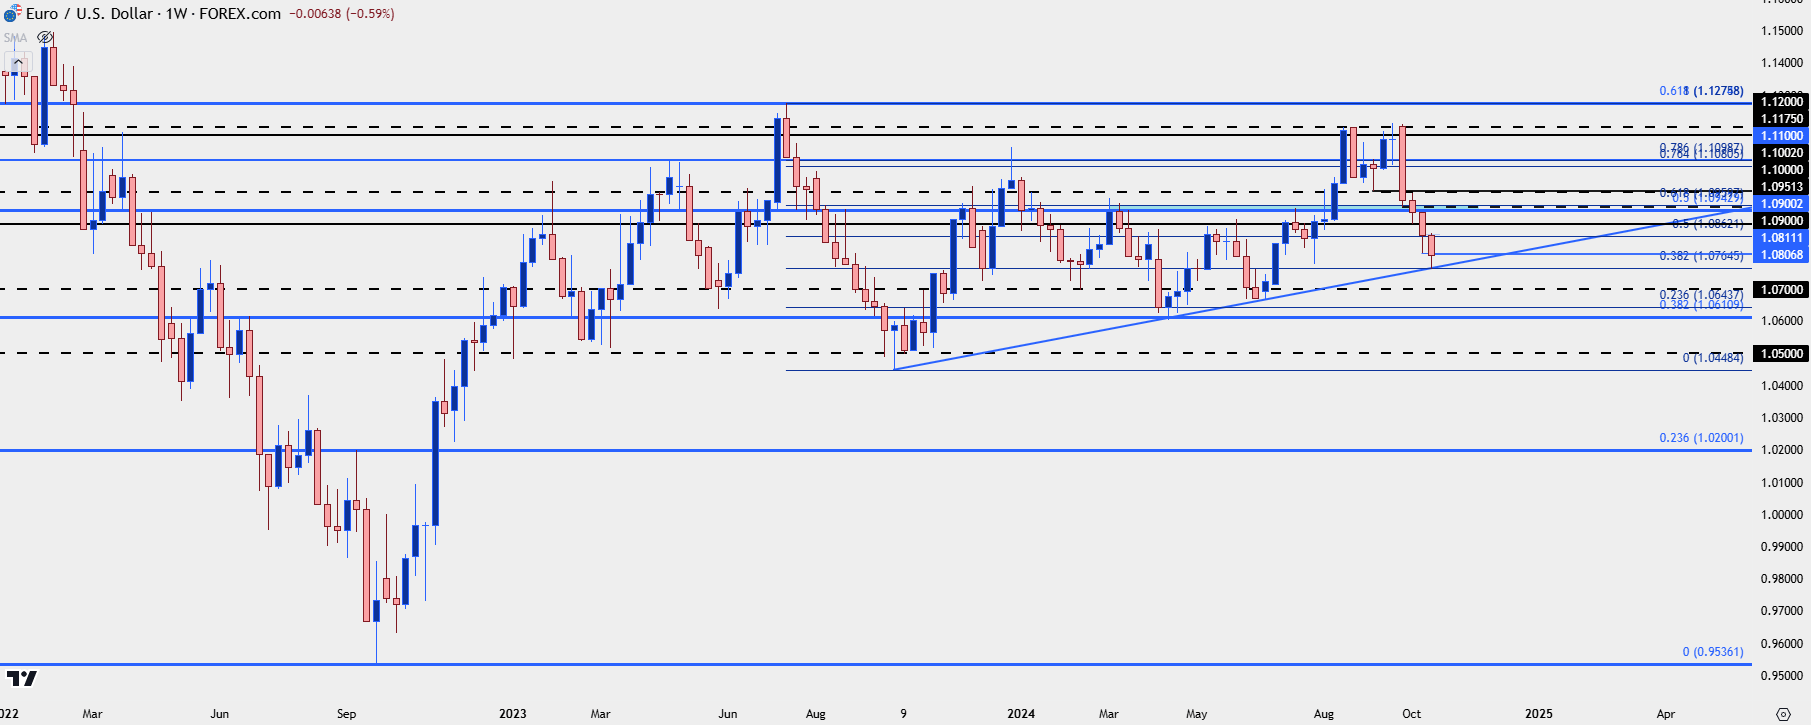 Chart prepared by James Stanley, EUR/USD on Tradingview
USD/JPY
USD/JPY put in a big breakout earlier in the week and the 151.95 level didn’t provide much for resistance. It has come back in as support, however, and this keeps bulls in the drivers’ seat for the pair, with the 200-day moving average so far helping to set the late-week lows.
Of note for Japan, there’s a general election over the weekend which could serve to stoke volatility. The inflation data released on Friday showed softening in both headline and core inflation, with each falling back-below 2%. This would remove some pressure to hike rates which could be construed as Yen-negative, but given the fast rise in the pair as weakness has come back to JPY over the past month, positioning will likely play a big role here -and if there’s a jolt on the political front we could see some fast movements.
As such, I’m going to widen out my bands for support and resistance. The 151.95 level is holding the lows as of right now, but pullbacks to 150.77 or 150.00 would put the spotlight on bulls for defense. On the upside of price, 153.41 is relatively close to the past week’s high but it’s the prior swing zone from 155.22-155.38 that stands out as deeper resistance potential.
USD/JPY Daily Price Chart
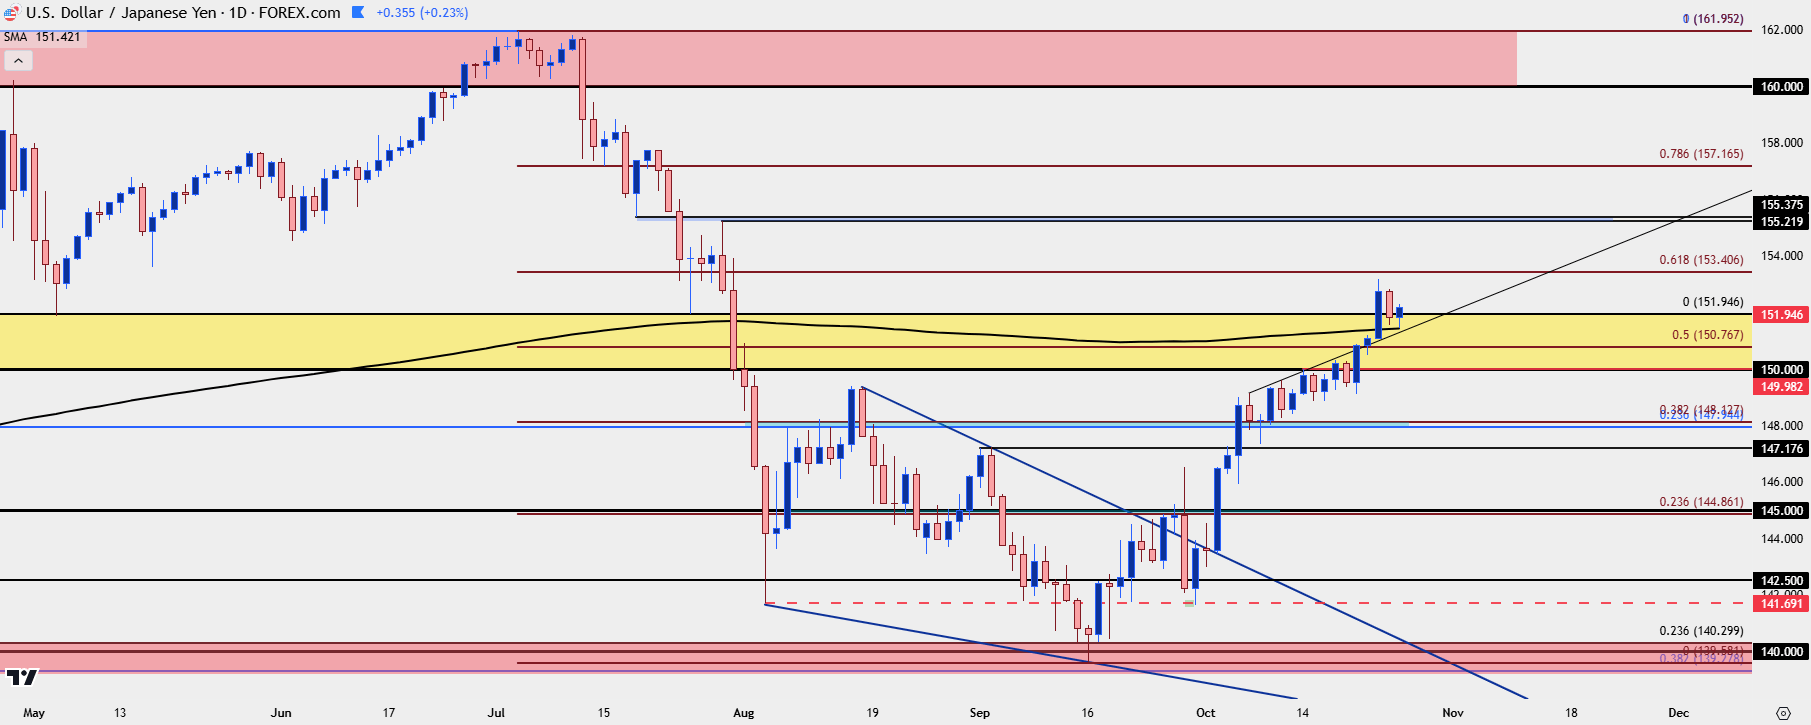 Chart prepared by James Stanley, USD/JPY on Tradingview
GBP/USD
Going into last week’s close Cable had put in a defense of the 1.3000 psychological level, with resistance ultimately showing at a spot of prior support of 1.3070. In early-trade last week, the pair pushed back below 1.3000 before making a failed run at the 1.2900 handle.
At this point, 1.3000 is still holding as resistance so we can’t quite say that the pair has put in much of a recovery, but if we do see the DXY pullback extend this is one that could become of interest. For that scenario to play, however, I’d first look to a re-take of control above the 1.3000 handle to illustrate that bulls have the willingness to drive a reversal theme in the pair.
Above 1.3000, I’m tracking shorter-term resistance at 1.3024 and then 1.3070, with a longer-term zone above that starting at around the 1.3102 level. The key for something like this would be a short-term higher-high at any of those three levels, followed by a hold of higher-low support at a key spot below that. So, for instance, if 1.3024 comes into the equation early next week, then I would want to see bulls hold support at or around the 1.3000 handle. Or, if the 1.3070 level is in the picture, then I would want to see cauterization of support at either 1.3024 or 1.3000. If it’s 1.3100 that marks a short-term high, then 1.3070 could be included in that equation as well.
At a minimum, such a scenario would allow for risk management when working with shorter-term trends inside of bigger picture pullback or reversal scenarios.
GBP/USD Four-Hour Price Chart
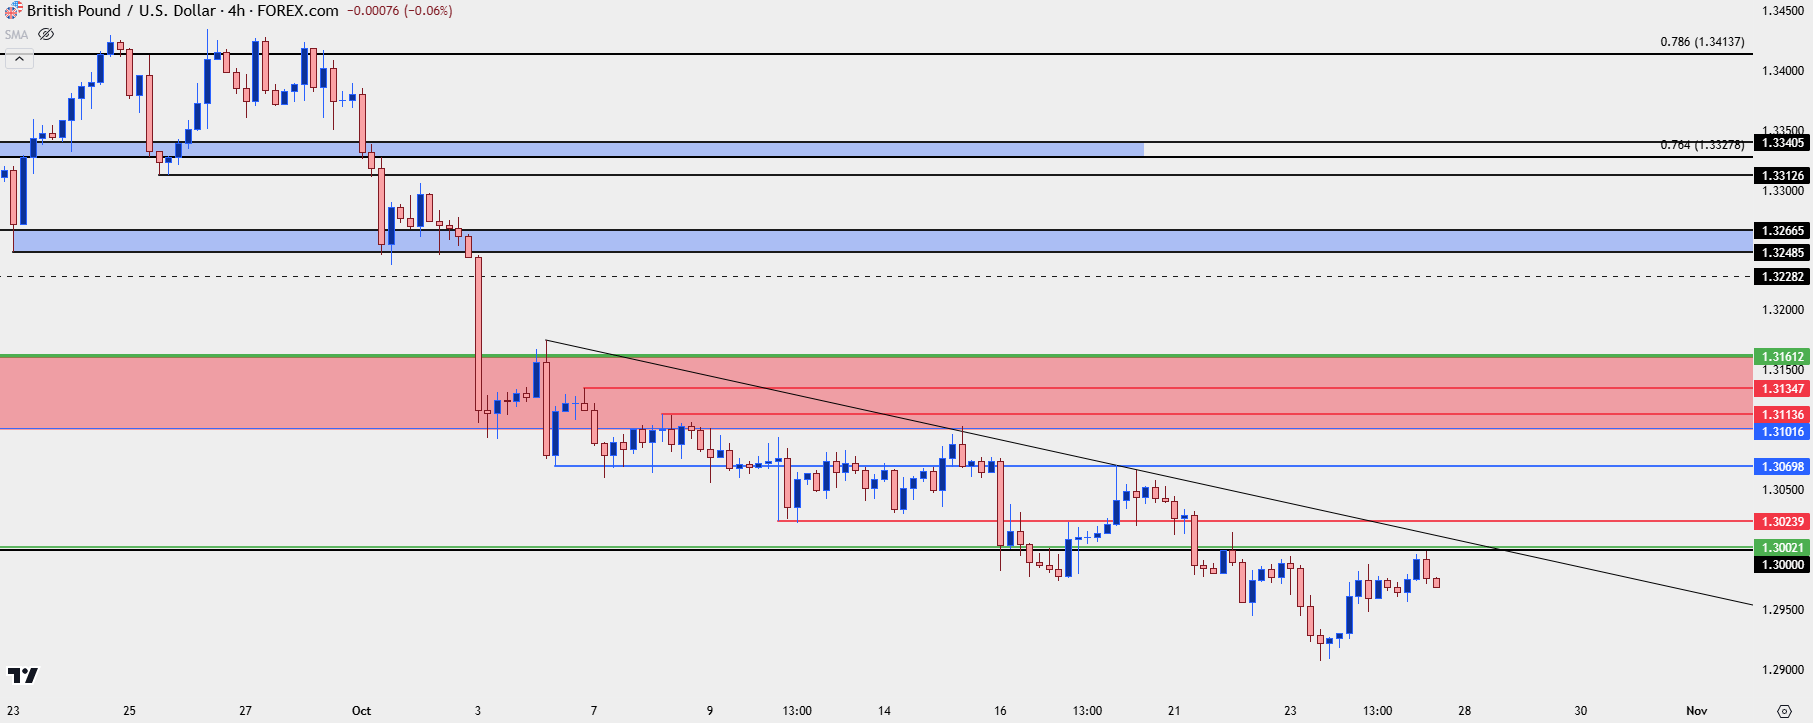 Chart prepared by James Stanley, GBP/USD on Tradingview
--- written by James Stanley, Senior Strategist


