Weekly Technical Trade Levels on USD Majors, Commodities & Stocks
- Technical setups we’re tracking into the open of the week / month
- Next Weekly Strategy Webinar: Monday, August 7 at 8:30am EST
- Review the latest Weekly Strategy Webinars on my YouTube playlist.
In this webinar we take an in-depth look at the technical trade levels for US Dollar (DXY), Euro (EUR/USD), British Pound (GBP/USD), Australian Dollar (AUD/USD), Japanese Yen (USD/JPY), Canadian Dollar (USD/CAD), Crude Oil (WTI), Gold (XAU/USD), S&P 500 (SPX500), Nasdaq (NDX) and Dow Jones (DJI). These are the levels that matter this week.
Crude Oil Price Chart – WTI Weekly

Chart Prepared by Michael Boutros, Technical Strategist; WTI on TradingView
Crude oil is attempting to mark a sixth consecutive weekly advance with WTI up more than 1% on Monday. The rally has taken out two major levels with the final resistance zone eyed at the 2021 & 2023 high-week closes at 82.69-83.28.
The focus is on a reaction into this threshold with a breach / weekly close above needed to suggest amore significant low is in place / a larger trend reversal is underway towards 88.76. Initial support back at the 52-week moving average (currently ~78.8) backed by medium-term bullish invalidation at 2018 highs near 77.85. Note that the median-line also converges on this zone and losses should be limited to this threshold IF price is heading higher on this stretch. Review my latest Crude Oil Short-term Outlook for a closer look at the WTI technical trade levels.
S&P 500 Price Chart – SPX500 Daily

Chart Prepared by Michael Boutros, Sr. Technical Strategist; S&P 500 on TradingView
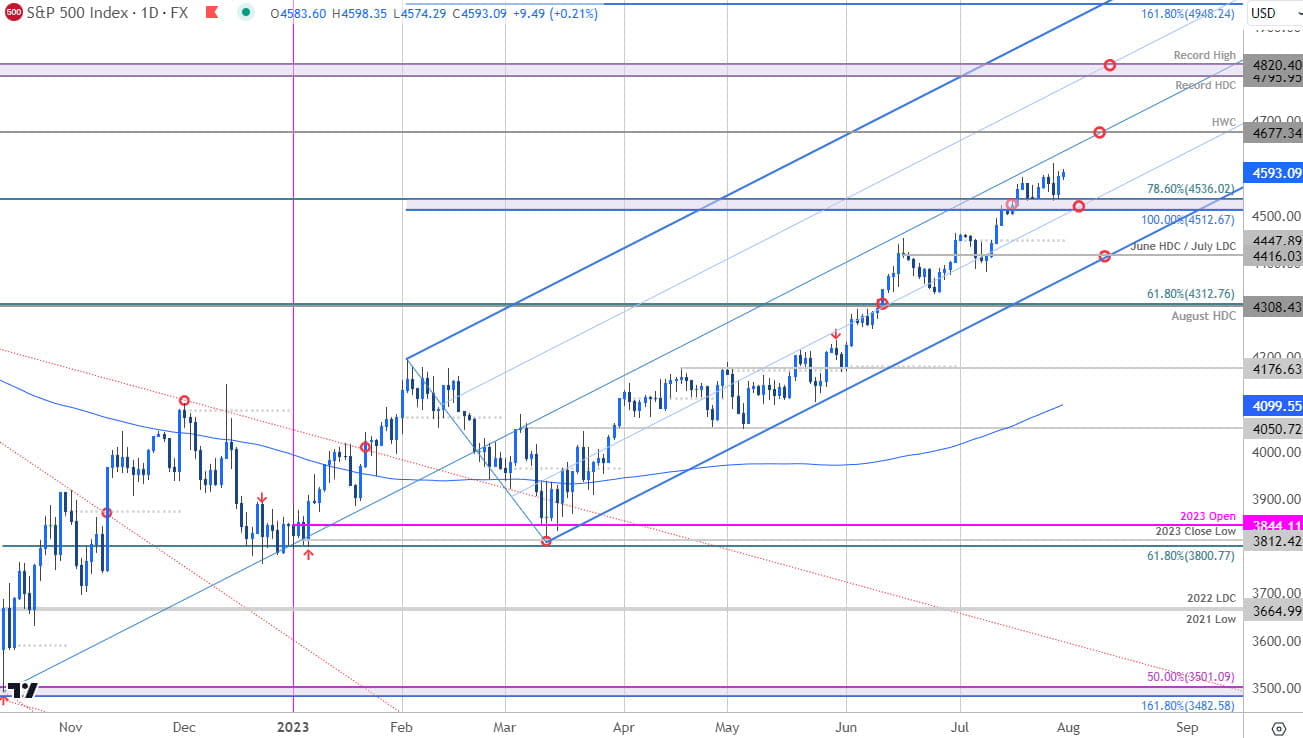
The rally broke above a key Fibonacci confluence we’ve been tracking of 4512/36- now support with broader bullish invalidation now raised to the June high-day close / July low-day close at 4415/16. Look for initial resistance along the median-line with subsequent resistance objectives eyed at the record high week close at 4677 and the record high / high-day close at 4795/4820.
We’re marking some bearish divergence on this last stretch, signaling the rally may be waning here. Bottom line- the advance is vulnerable into the median-line, and we’ll be looking for a possible topside exhaustion into the high-week close IF reached.
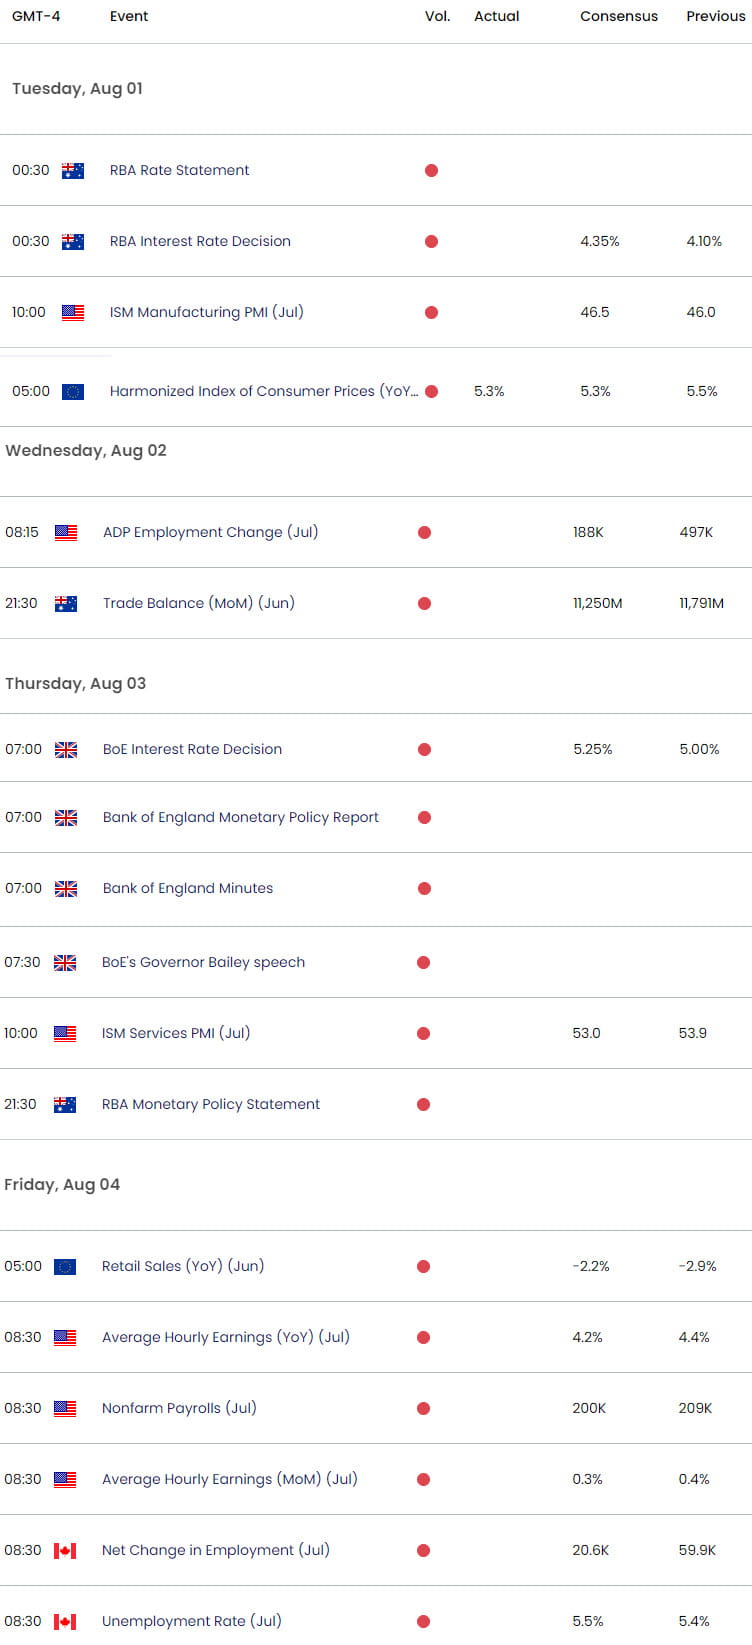
Economic Calendar – Key Data Releases

--- Written by Michael Boutros, Sr Technical Strategist with FOREX.com
Follow Michael on Twitter @MBForex


