FTSE bulls need to break above 6800
After a weak handover from Wall Street & Asia the FTSE is pointing to a mildly negative start.
Elevated US treasury yields continue to sap demand for equities.
UK Q4 GDP final reading came in better than expected recording 1.3% QoQ growth versus 1% previously. YoY recorded -7.3% versus -7.8% previously. Business investment was significantly better than forecast at 5.6% vs 1.3% previously.
Where next for the FTSE?
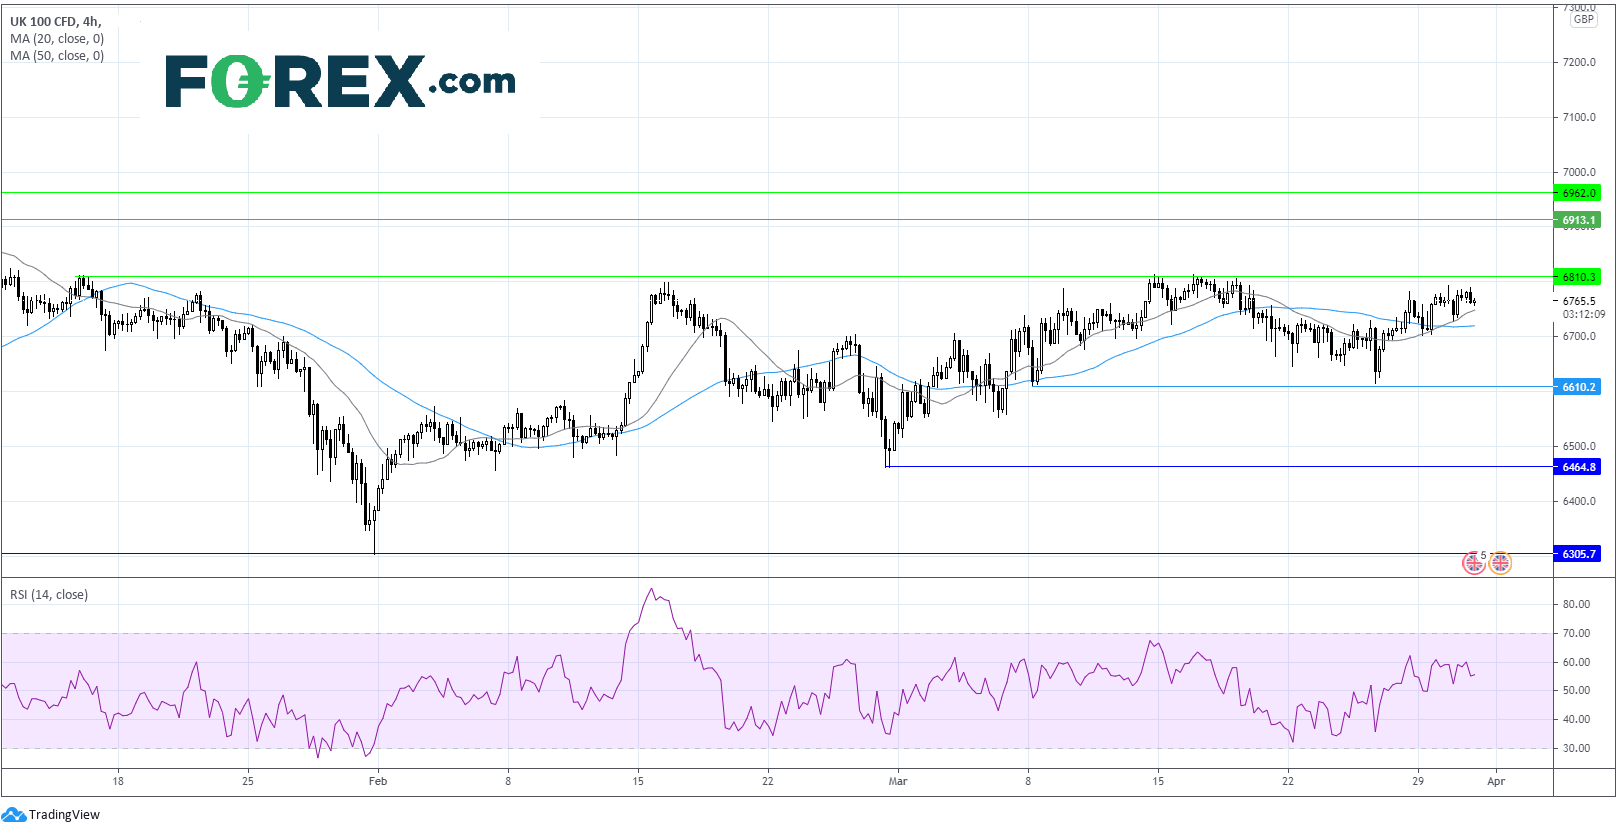
The FTSE has been trading with a horizontal channel since early March, with the upper band around 6800 and the lower band at 6600.
The price has managed to claw back to the upper end of the channel, trading above its 20 & 50 sma on the 4 hour chart. The 20 sma also crossed above the 50 sma in a bullish signal.
The RSI is also showing a mild bullish bias.
A move above 6800 is key in order for the FTSE to advance towards 6915 the January high and a level which has remained elusive since.
Failure again to break through 6800 could see the 50 sma tested at 6720. A move below this level could open the door to 6610, it would take a break below here for the sellers to gain momentum.
Learn more about trading indices

US Dollar Index (DXY) holds 93.00 ahead of Biden’s speech & ADP data
The US Dollar index has been well supported over recent sessions as investors bet that the Biden administration’s huge fiscal stimulus, coupled with an aggressive vaccine rollout will help the US economy recovery rapidly from the pandemic.
US President Biden is due to speak later today, laying out how a $3 - $4 trillion infrastructure plan will be funded.
Data yesterday revealed that US consumer confidence has soared to the highest level since the start of the pandemic.
US ADP private payroll report is also due ahead of Friday’s non farm payroll report. Expectations are for a blowout 550k jobs vs 117k in February
Learn more about the non farm payroll
Where next for the US Dollar Index?
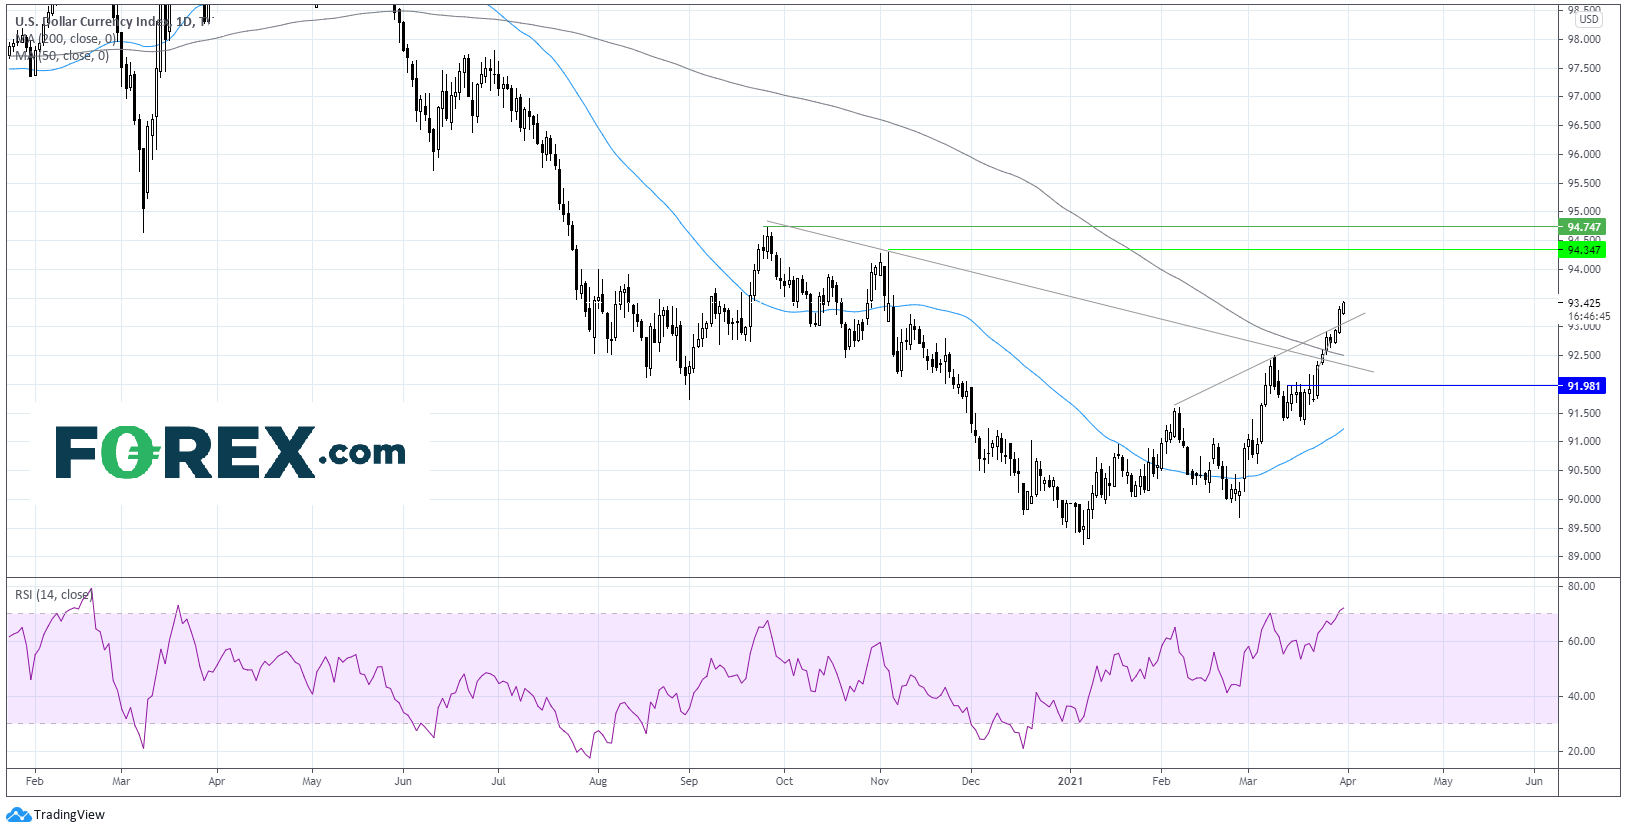
The US Dollar Index is holding steady at 93.40 in early trade hovering around a level last seen in November last year.
DXY has broken above its descending trendline dating back to late September, it has also pushed above the 200 sma on the daily chart and pushed above its 2 month ascending resistance trendline, a set up which favours the bulls.
Any move higher will need to overcome resistance around 94.30 (high Nov 5) and a key resistance of 94.74 the late 2020 high.
On the fliop side, failure to hold above the trendline resistance at 93.10 could see the DXY attack a crucial support around 92.30 the confluence of the 200 sma and the descending trendline. A break below here brings 92.00 round number into the picture ahead of 91.20 the 50 sma.
Learn more about trading forex


