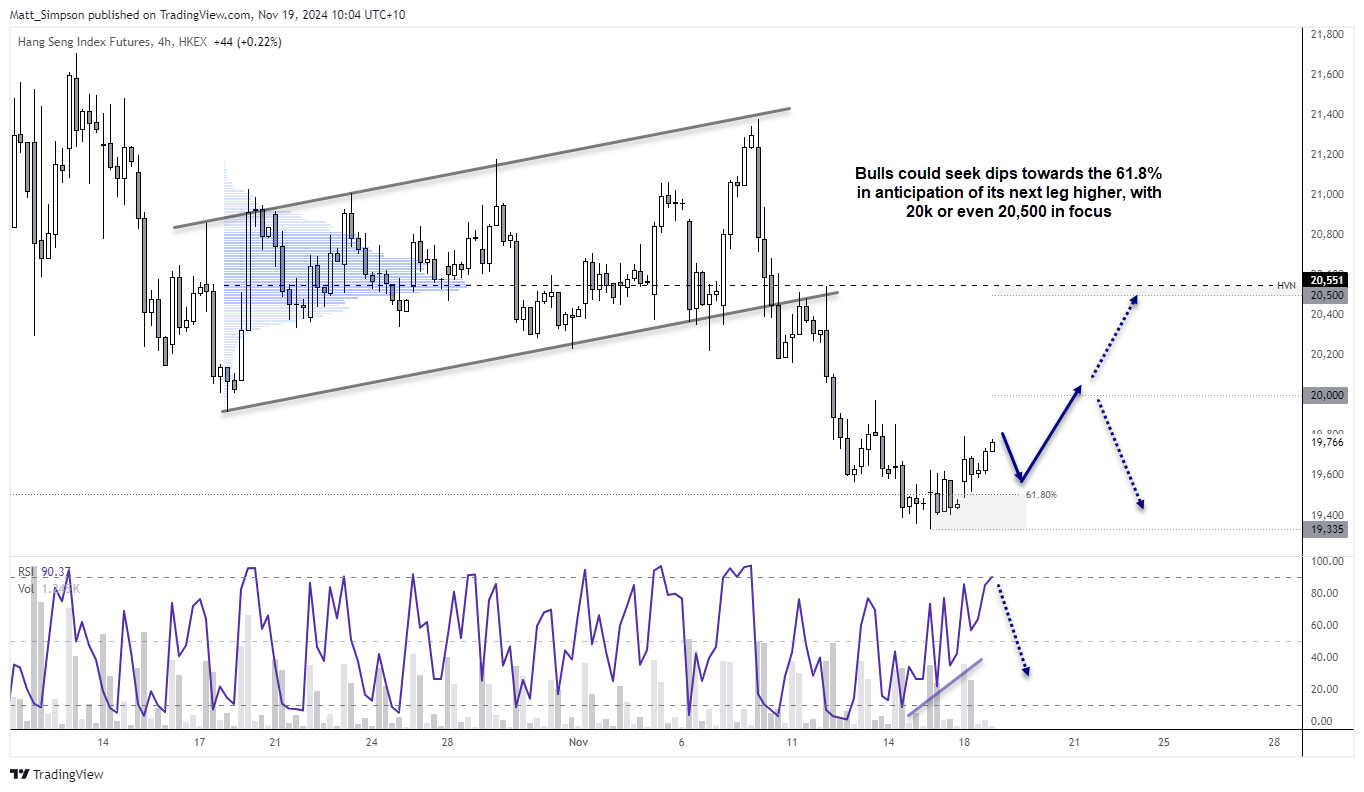
The Hang Seng futures market seems to have a solid relationship with the 61.8% Fibonacci level. Three times since August we have seen the market turn higher after a brief spell beneath it. And we’ve seen the market rise six timers from a 61.8% this year, notching up gains of between 6.5% or nearly 50%.
Also note that a 3-wave correction has formed since the October high, which begs the question as to whether we’ve seen the corrective low and prices will go on to break above the October high. Alternatively, will we see a minor bounce from current levels before losses resume? Given the uncertainty surrounding potential tariffs, I’m inclined to back the second scenario of a minor bounce before new lows are achieved. Either way, the charts suggest a cheeky long, as least over the near term.

A 3-day bullish reversal pattern formed by Monday’s close (morning star reversal) and the daily RSI (2) had reached its most oversold level since September on Friday. Furthermore, momentum is now turning higher from the 61.8% Fibonacci level between the 47% rally seen between the September low and October high.

A bullish divergence formed on the 4-hour RSI (2) ahead of the cycle low. Yet as the RSI is now overbought I am now on guard for a pullback. Bulls could seek dips towards the 61.8% Fibonacci level for longs, with 20k or even 20,500 in focus for potential upside targets.
-- Written by Matt Simpson
Follow Matt on Twitter @cLeverEdge


