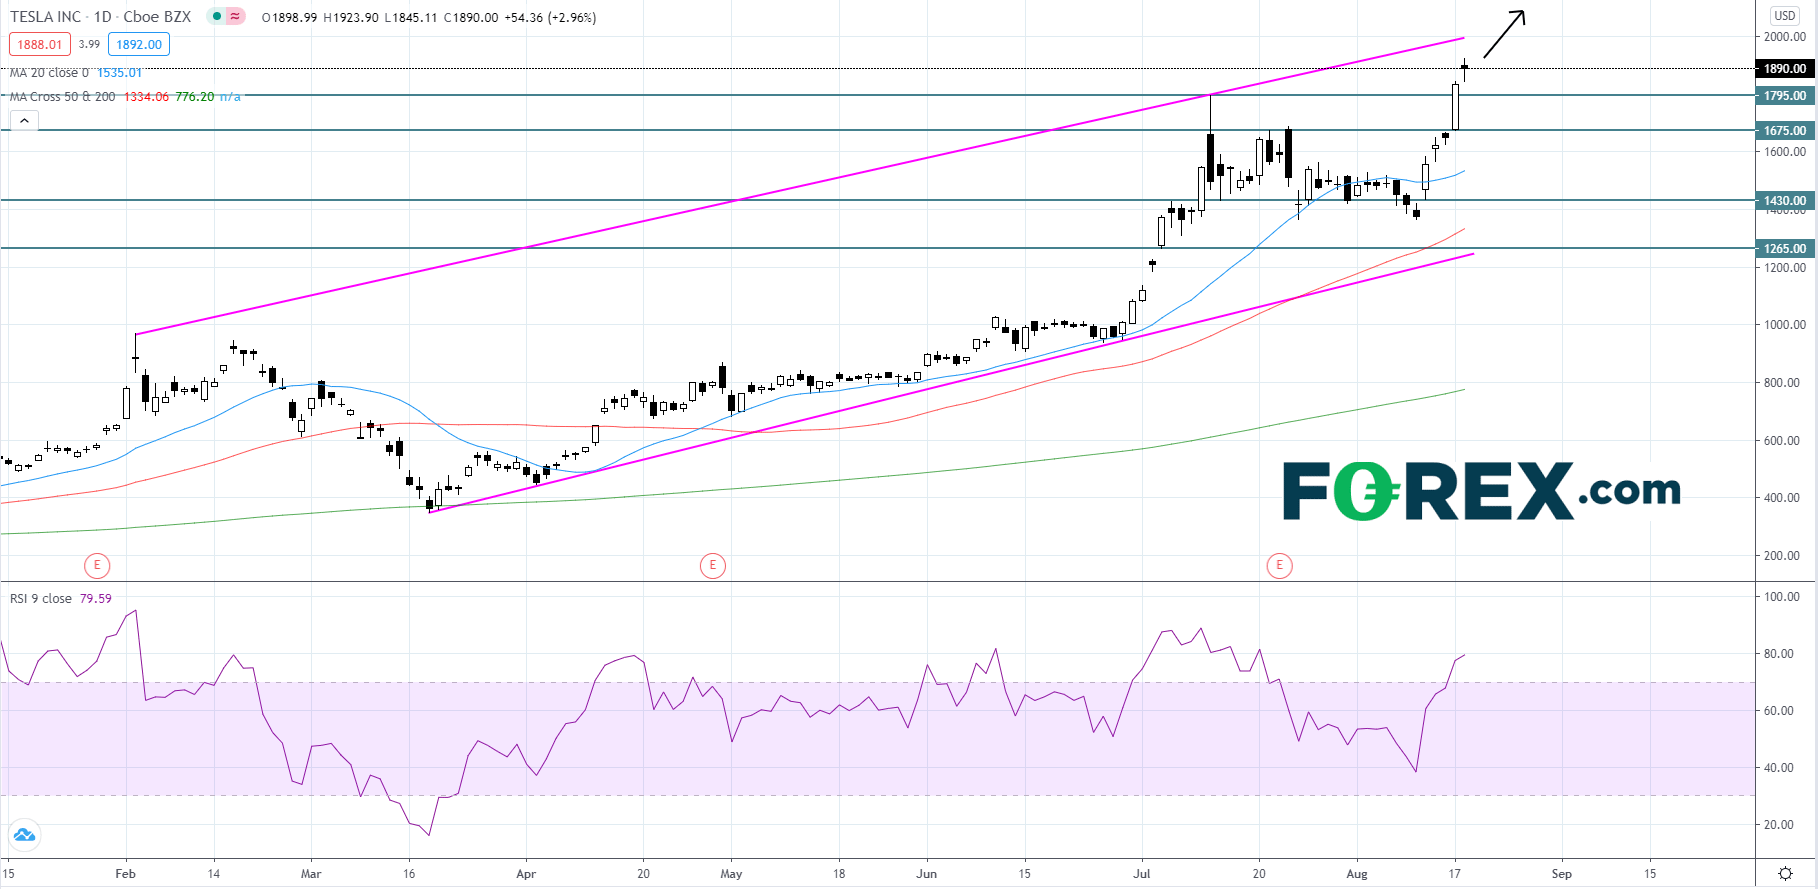
On Monday, Tesla (TSLA), the electric-vehicle maker gapped up 1.6% at the open and finished the day up 11.2% making another record high at 1,845.86, bringing its year-to-date gains up to roughly 335%.
Looking at a daily chart, Tesla's stock price appears to be rising inside of an ascending wedge pattern that began to form in the first quarter of 2020. The RSI is showing bullish momentum and sitting just below 80 in overbought territory. Price will likely continue to advance to touch the upper trendline around the 2,000 level. If price reaches the 2,000 handle, we could see a wave of optimistic buyers enter the market and push the price even higher causing it to break out to the upside of the ascending wedge pattern. However, given the overbought reading on the RSI traders should be prepared for a pull back that could bring price down to its 1,795 support level, where a bounce could occur. If price breaks below the 1,795 support level, then we may see a bounce at 1,675.

Source: GAIN Capital, TradingView
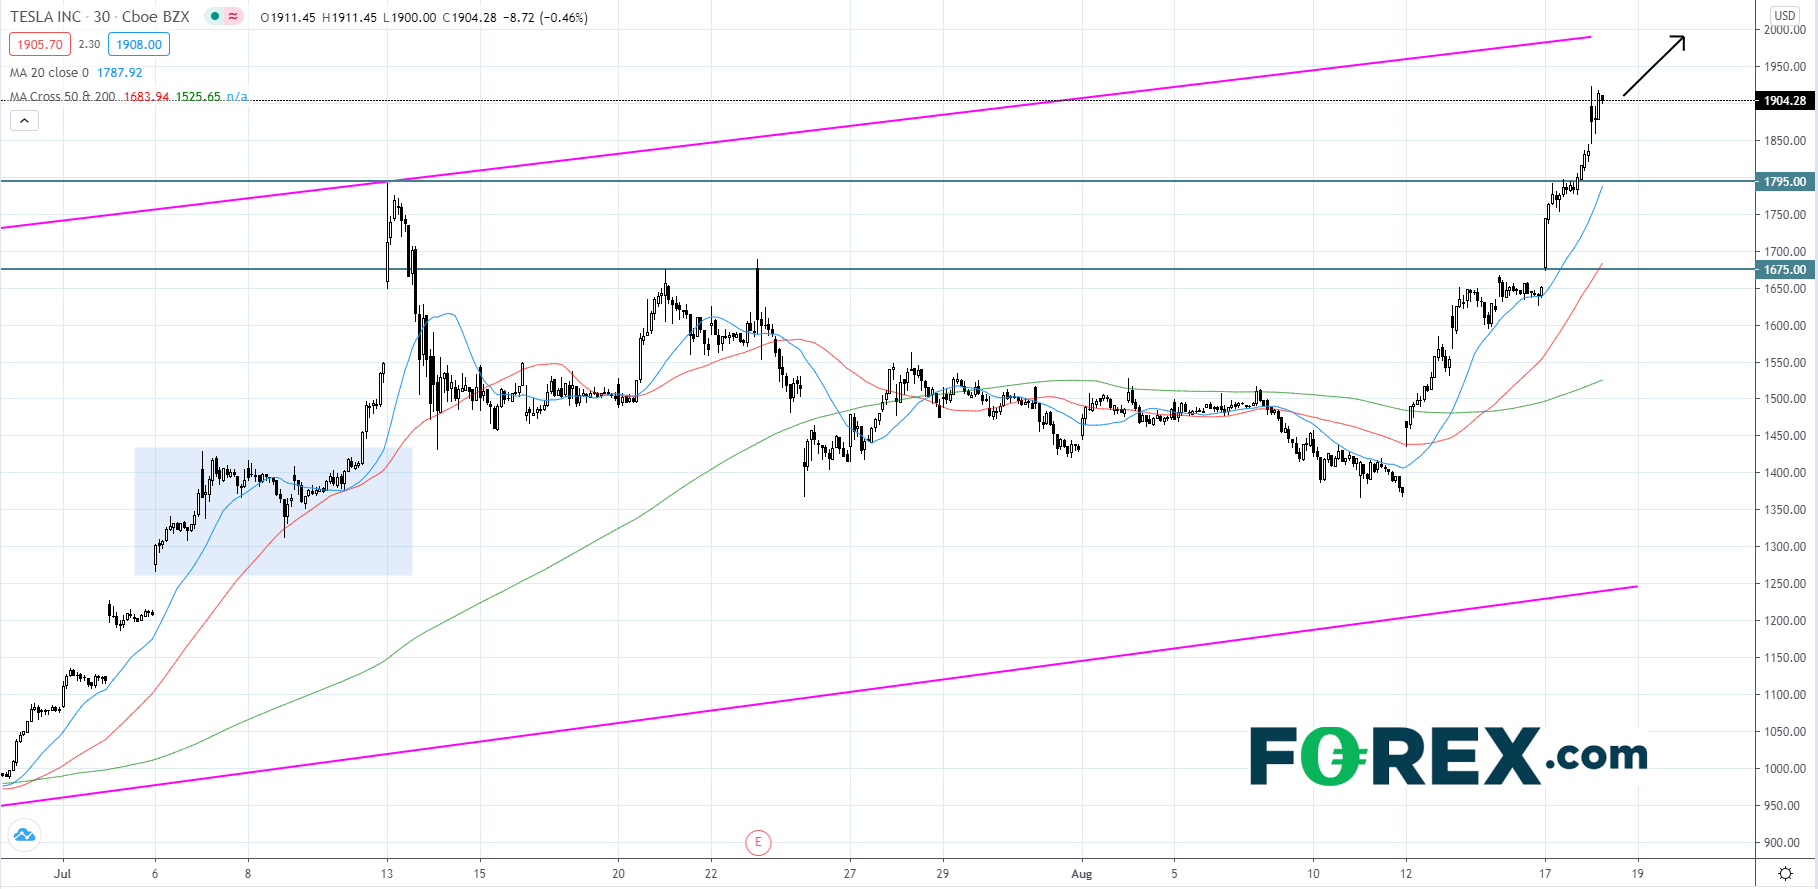
Looking at a 30 minute intraday chart, Tesla's stock price is advancing at rapid pace and using the 20-periood moving average (MA) as support. On a short-term basis if price breaks below the 20-period MA one should be cautious. However, looking back to price action in early July, we can see that even though price broke the 20-period MA it found support on the 50-period MA before continuing to rise. Thus, speculators should use the 50-period MA as the pivot point for intraday trading.

Source: GAIN Capital, TradingView


