S&P 500 Talking Points:
- The headlines this morning have so far been about the bearish reaction to NVDA earnings that didn’t seem to be all too bad, combined with the announcement of a stock buyback. Such a reaction highlights an overbought market, but today’s price action will be telling.
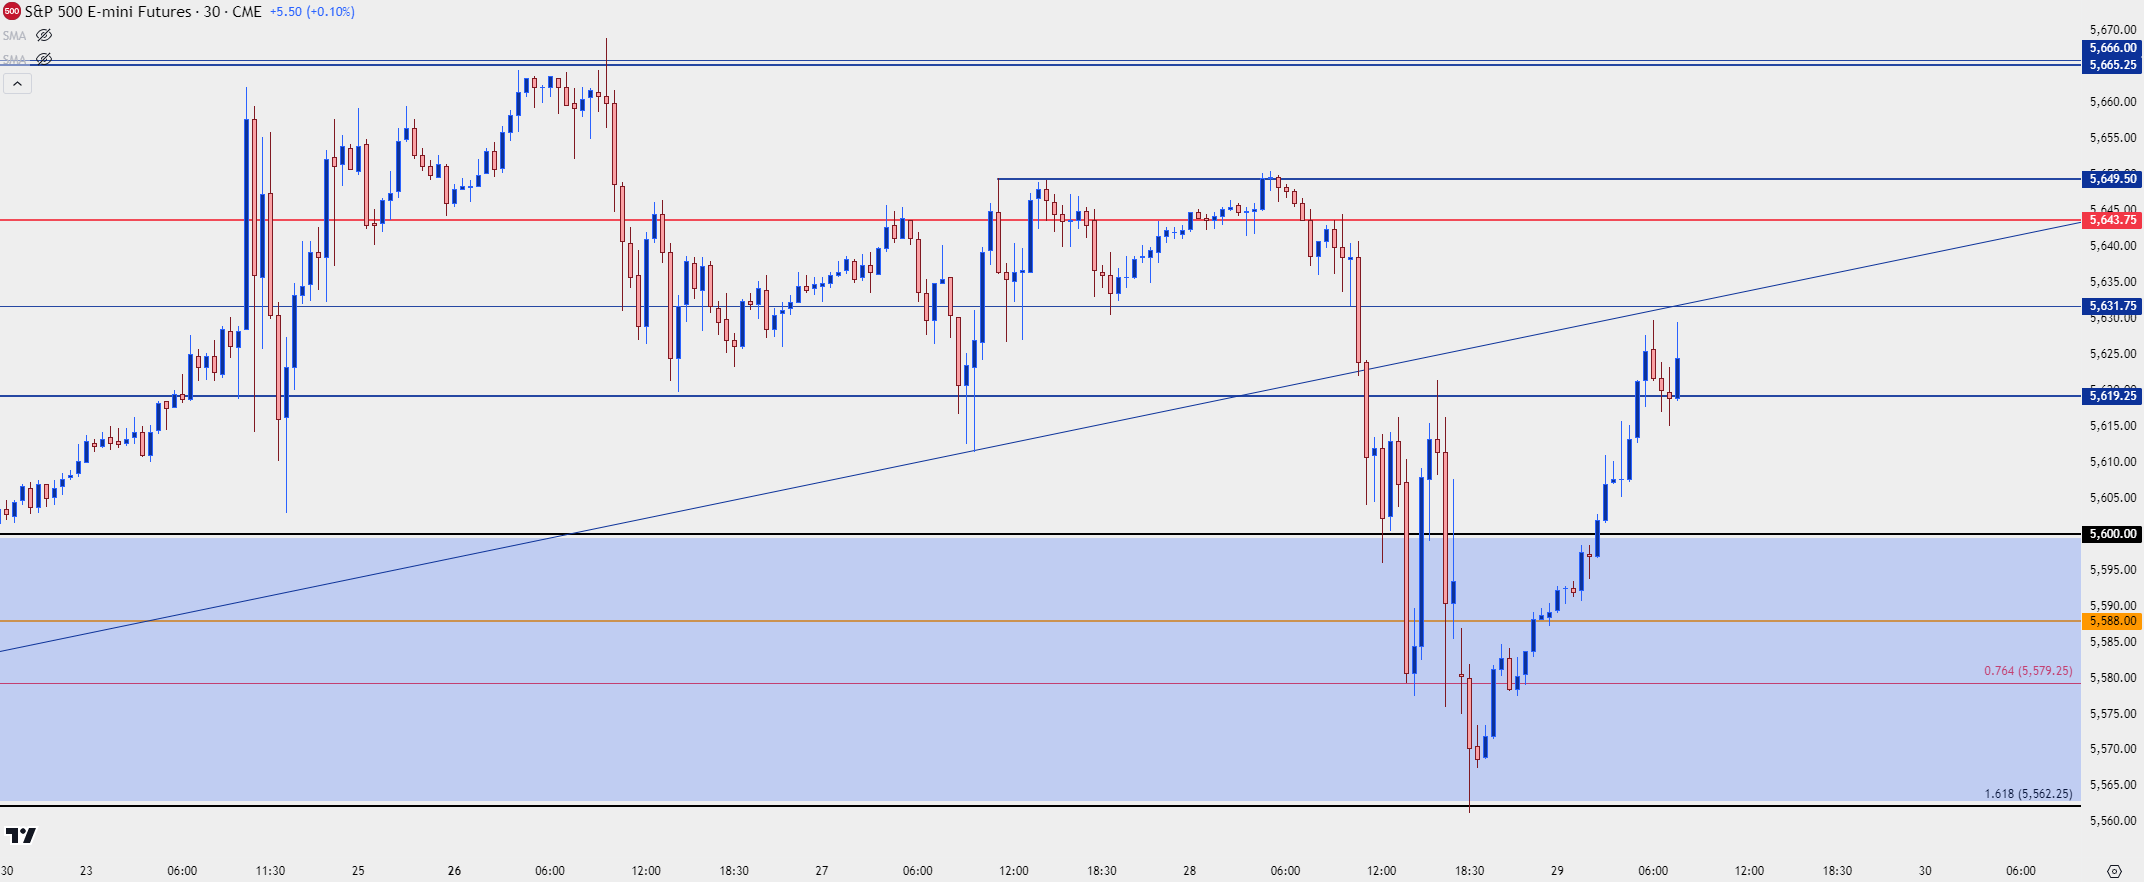
- In the S&P 500, buyers were on their back foot through much of yesterday’s session and after futures re-opened at 6PM ET, ES dropped down for a test of the bottom of the support zone at 5562.25. That led to a massive rally that’s continuing to drive this morning.
As the old saying goes, when a market sells off even on good news, look out below.
Fundamentals often have impact on price but they’re not a direct driver. The conduit for fundamentals to get priced-in is sentiment, or how a market is positioned. And if anyone or almost anyone that wants to be long of a stock already is, and even if a ‘good’ news report comes out, well – there’s nobody left on the sidelines to buy. So there’s no influx of demand to push prices-higher. This can lead to anxiety in current longs and this could cause selling on the lack of reaction. And then as prices are going down, even despite the positive news that had just hit, that could cause discern amongst other longs, thereby leading to even more selling pressure.
Sentiment matters, and when a hot stock starts to see bearish price action even on the back of good news, change may be afoot. It may be a sign of a market already heavy with longs looking to take profits.
It’s still early for NVDA, however, as their earnings beat yesterday was coupled with announcement of a stock buyback for $50 Billion. And after-hours trading can be notorious for noise as this isn’t something that’s getting participation across the market. Today could be more telling.
S&P 500 Futures
Yesterday’s session in ES was a grinding one with bears forcing a pullback down to range support as we moved towards the NVDA earnings release after-the-bell. The 5579.25 level held the low ahead of the daily close on two separate occasions, with the first bounce leading to a resistance test at a prior support level of 5619.25.
It’s what happened after the open at 6PM that remains of interest, as prices dropped down to the bottom of the longer-term support zone, the same S4 level that I had looked at yesterday – and then caught a massive bid that continues to price-in this morning.
S&P 500 Futures 30-Minute Chart
 Chart prepared by James Stanley; data derived from Tradingview
S&P 500 Bigger Picture
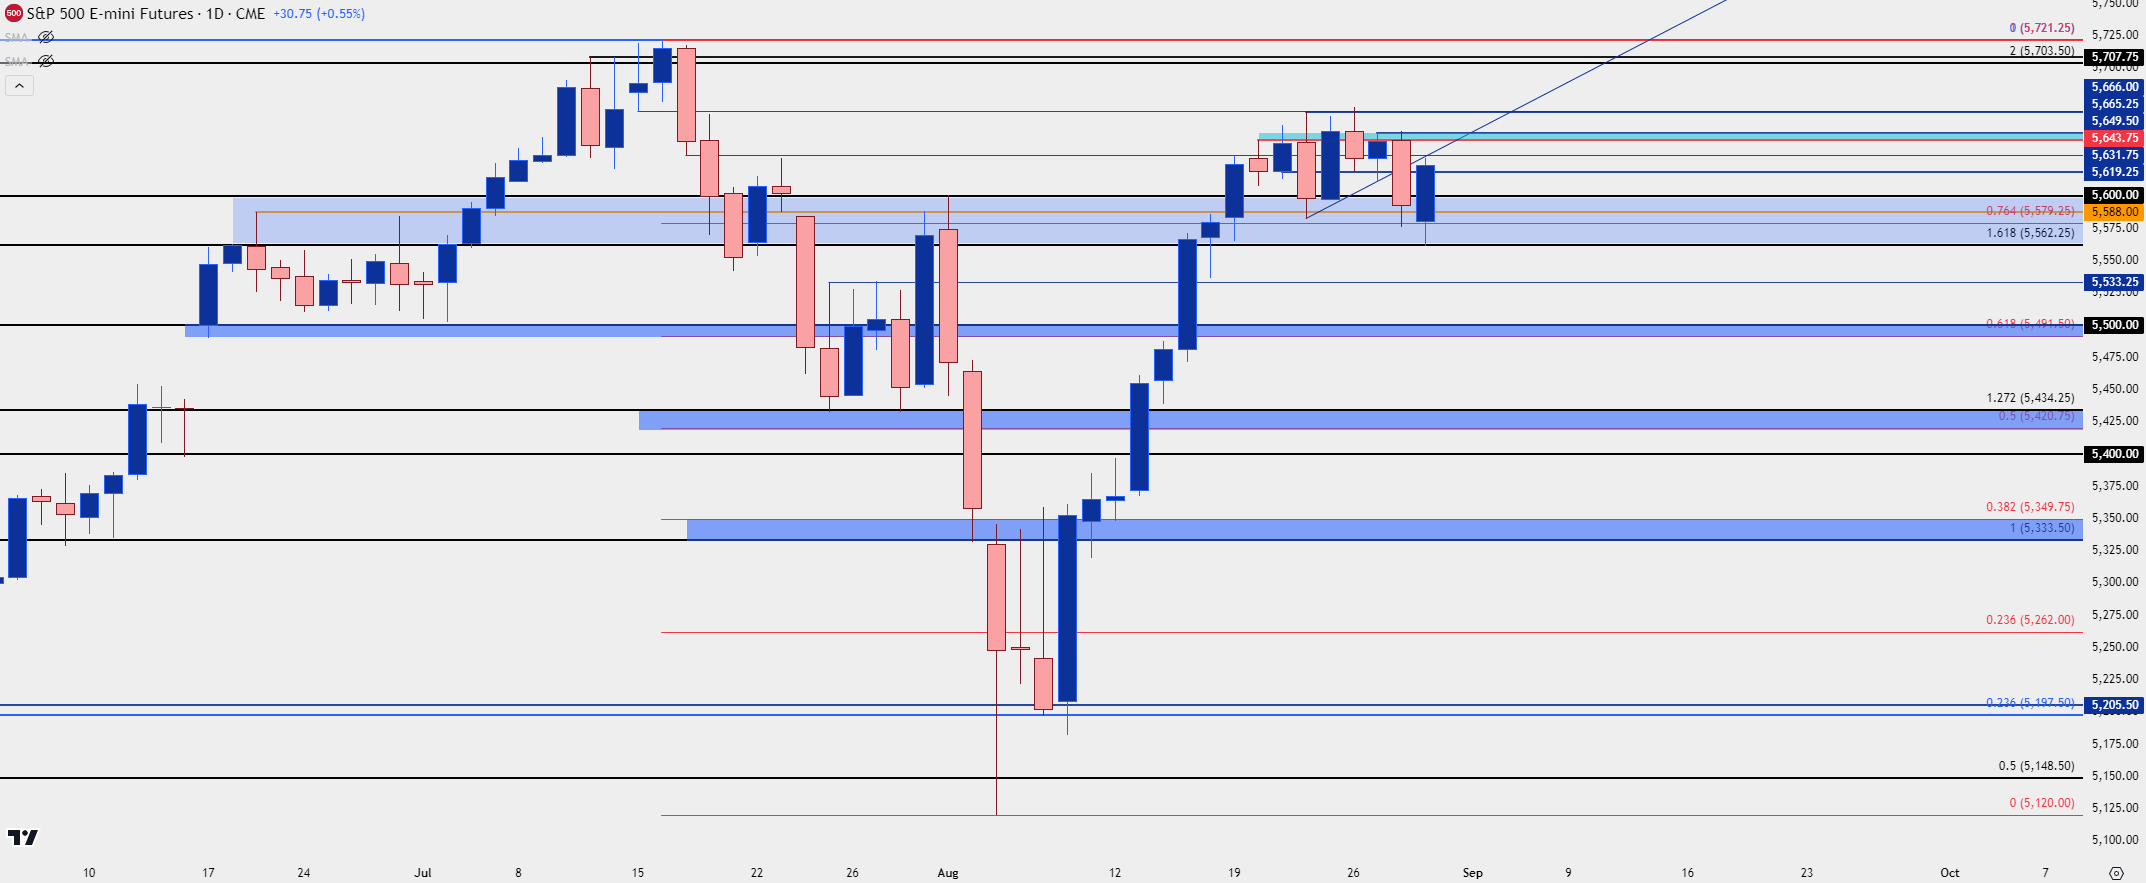
A move such as we saw yesterday can be disconcerting for bulls as there wasn’t exactly a bad piece of news that caused the sell-off. And given the stall in the S&P inside of the ATHs that were set in July, even after the Powell pivot announcement last Friday, and there’s perhaps even more cause for concern on the long side of the move.
But the reaction to that support looked at above has been intense, and this indicates that the market isn’t ready to roll over just yet. The bigger question will be how bulls handle resistance and whether the support test last night can continue into a topside trend. But, for levels, given the context, I’m looking at largely the same setup for today. For resistance the 5643.75 level has continued to bring sellers in and yesterday’s high at 5649.50 can be spanned down to that level to create a zone. Above that, 5666 still looms large and if bulls can test through that, then we have the 5700 level to come into play.
For support, both 5579.25 and 5562.25 are somewhat obvious at this point; and I’m going to continue to track 5600 as a level of note as this showed a couple of minor support bounces during yesterday’s session.
Resistance:
R1: 5643.75-5649.50
R2: 5666
R3: 5700
R4: 5721.25
Support:
S1: 5600
S2: 5588
S3: 5579.25
S4: 5562.25
S&P 500 Daily Price Chart
 Chart prepared by James Stanley; data derived from Tradingview
--- written by James Stanley, Senior Strategist


