S&P 500 Talking Points
- The weekly bar is showing as a spinning top at this point and the churn and grind in the S&P 500 is now going on its 10th day.
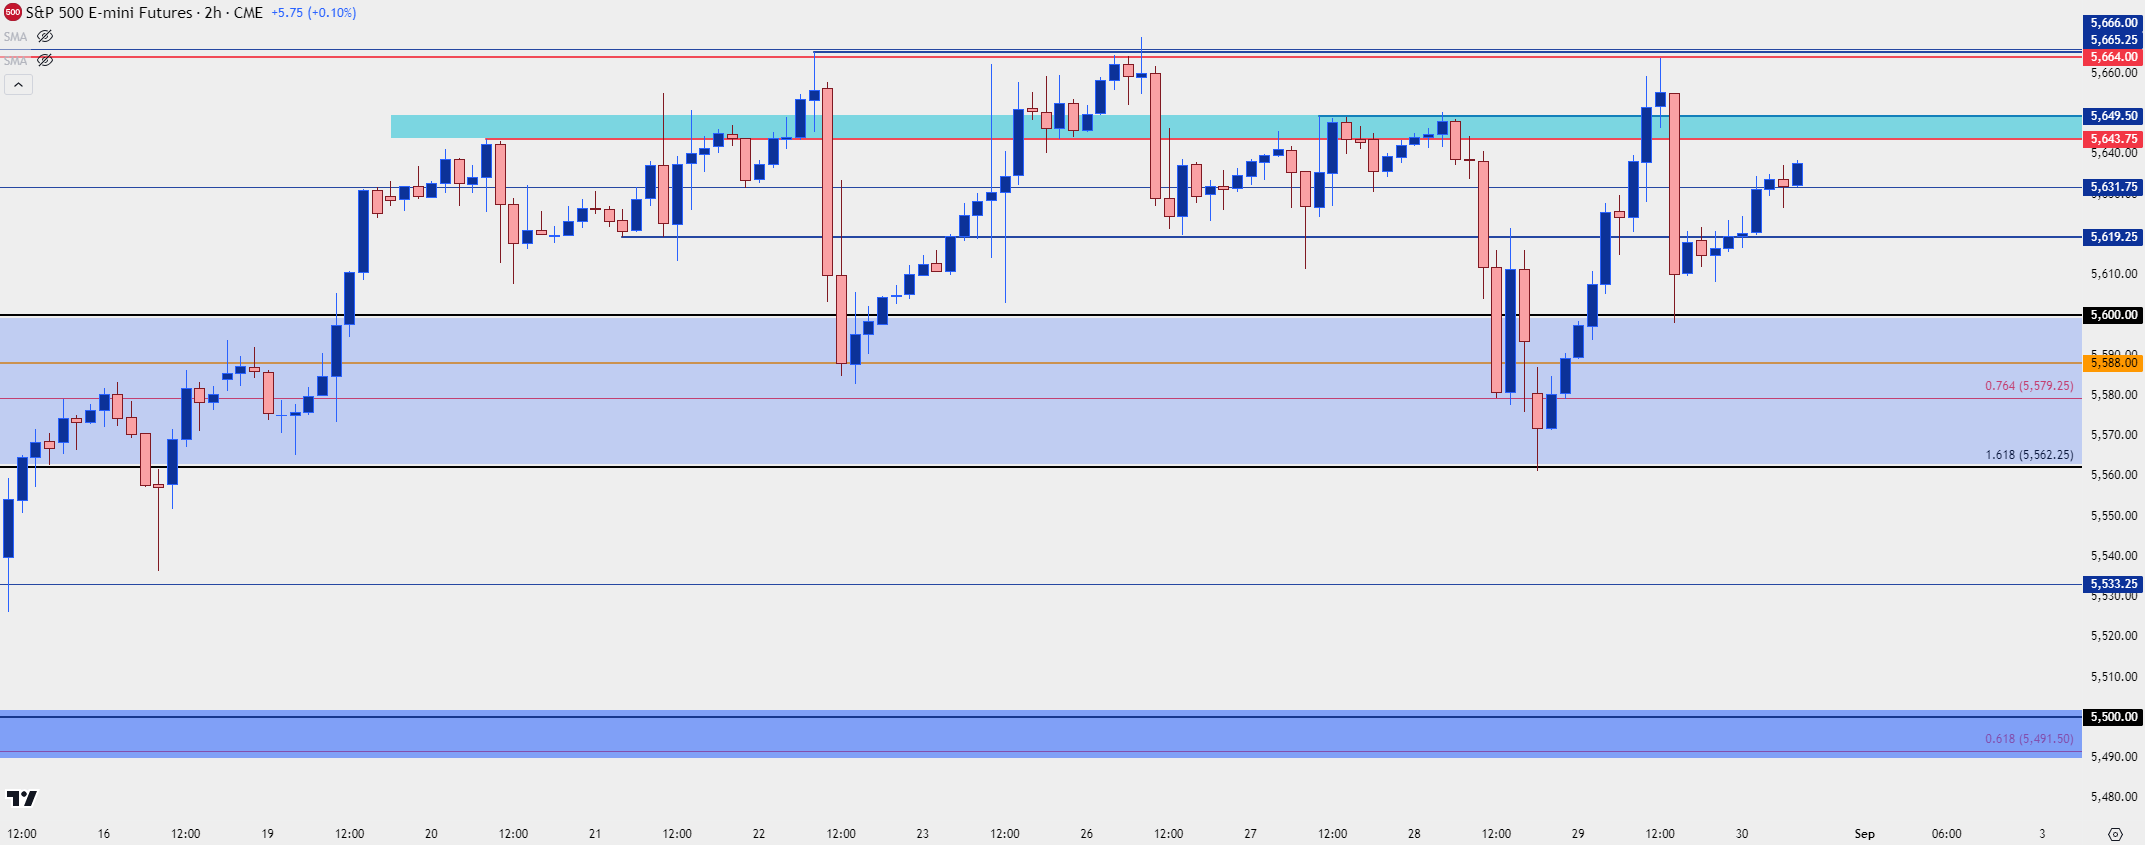
- Yesterday showed resistance holding at the same 5664 level that was in-play as the high last week and then again on Monday, the reaction from that however held a higher-low at 5600 with price not re-testing on the 5562.25 level.
Given the drivers over the past week, with Powell’s proclamation of pivot last Friday and then an NVDA earnings report that saw the company again beat earnings, one might’ve expected a stronger reaction in US equities. But as it is, the past nine trading days have shown a significant amount of grind and given the threat of breakdown after that NVDA earnings announcement, one might say that bears have started to show a bit more prominently.
When a market fails to gain on the back of seemingly good news, that’s an illustration of overbought conditions with one-sided positioning. And this could be something of interest in the next week or two as bulls have started to look beleaguered after a 10% jump in a little more than two weeks, which has led-in to this stall.
The big item for me this week was the support hold at 5562.50. That led to a sharp rally that saw buyers drive all the way to resistance through early-trade yesterday, until resistance again showed at 5664. The reaction to that resistance yesterday was aggressive – with a fast retracement showing in late-session trade, the pullback of which held support at 5600 followed by bulls showing up to drive the bid.
S&P 500 Two-Hour Price Chart
 Chart prepared by James Stanley; data derived from Tradingview
S&P 500 Shorter-Term Strategy
There’ve been some aggressive swings in the index even despite the grinding backdrop. And those reactions have shown at levels that I’ve looked at throughout this week, and as noted above, the deduction of the fact that stocks haven’t rallied more aggressively on a seemingly bullish backdrop is something that could potentially be of interest in the weeks ahead. But, for now, bulls are still exhibiting control and until the 5562.50 level is a major spot of internet for buyers to retain control.
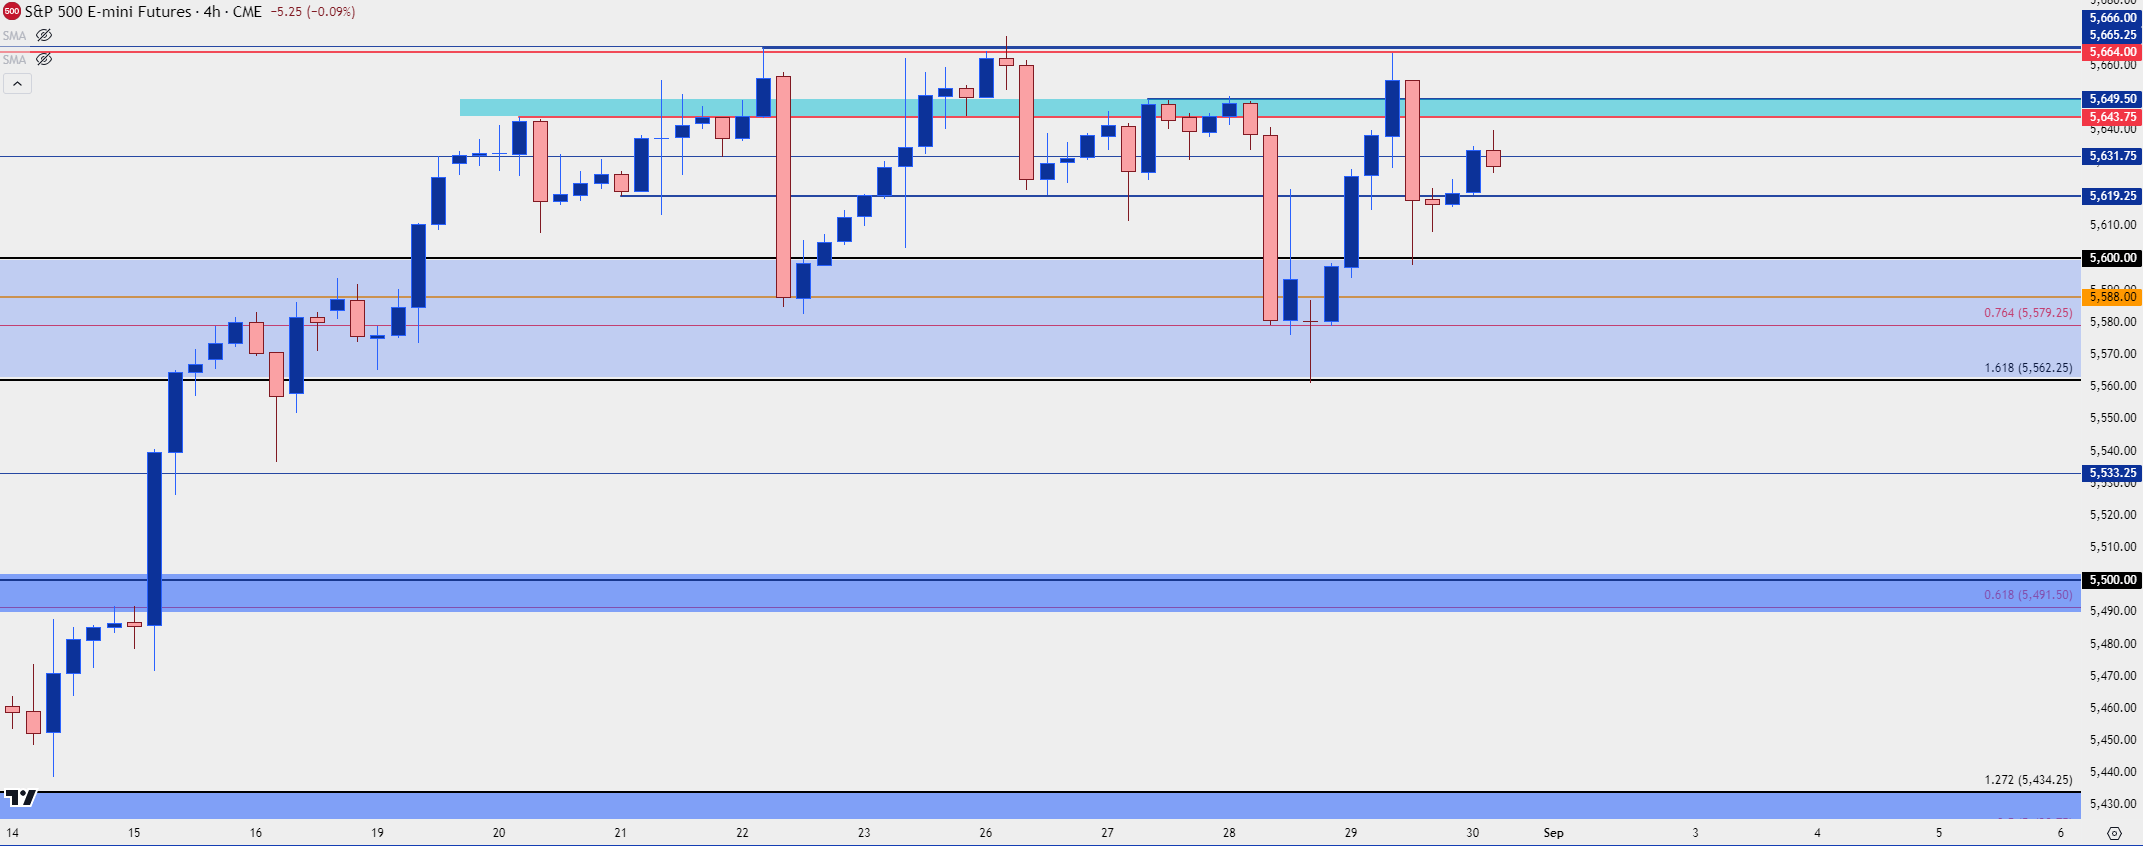
At this point we’re close enough to the weekly close where we can start to formulate possible scenarios for next week. If there’s continued failure from bulls to drive through the ATH resistance zone at 5700, and if bears can push through 5562.50, then the door for a larger pullback will open with focus on the 5491.50-5500 zone. And below that is another key zone, spanning from 5420.75-5434.25 followed by a third at 5333.50-5349.75.
On the resistance side of the coin, the 5664/5666 area is obvious as it’s been the line that buyers haven’t been able to cross as the stall has developed. Above that is one more key zone at 5700-5721.50 which marks the all-time-high. If bulls can power through that, they have an open door to continue driving.
For near-term levels, I’m tracking a similar format as the past week.
Resistance:
R1: 5643.75-5649.50
R2: 5664-5666
R3: 5700
R4: 5721.50
Support:
S1: 5600
S2: 5562.50
S3: 5333.25
S4: 5491.50-5500
S&P 500 Four-Hour Price Chart
 Chart prepared by James Stanley; data derived from Tradingview
--- written by James Stanley, Senior Strategist


