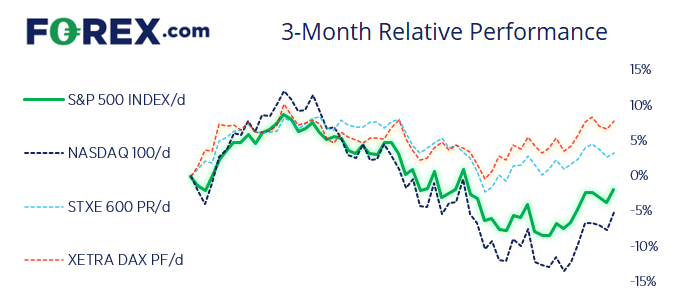

S&P 500 weekly chart:
The S&P 500 has seen an ABC correction from its record high. Whether we have seen the final low of the correction remains debatable (given the prospects of lower growth, high inflation and a hawkish Fed). This could simply be part of a bear-market bounce and therefore we’re in a countertrend rally of a much deeper correction. But we can see that it has had a decent retracement from those highs, support was found at a long-term 38.2% Fibonacci ratio, momentum has turned higher and the stochastic oscillator generated a buy signal last week.

S&P 500 daily chart:
The daily chart also looks promising for the bull-camp. A bullish engulfing (and bullish outside) day formed at the 20-day eMA and closed to a 4-week high. Momentum from the 3800 low was strong and invalidated a bearish trendline. Should prices hold above 4070 then we anticipate a breakout – back above the 50-day eMA – and move to the 4279 resistance zone which includes a 61.8% Fibonacci projection and 4300 handle. Whereas a break below the 4070 area means we may have seen an important swing high.

How to trade with FOREX.com
Follow these easy steps to start trading with FOREX.com today:
- Open a Forex.com account, or log in if you’re already a customer.
- Search for the pair you want to trade in our award-winning platform.
- Choose your position and size, and your stop and limit levels.
- Place the trade.


