It’s well known that indices tend to have a bullish bias overall, given their ability to eventually break to record highs over the long term. This means that, given a large enough sample size, forward testing anything more than a few weeks is very likely to generate positive results and mask the few and sudden downturns.
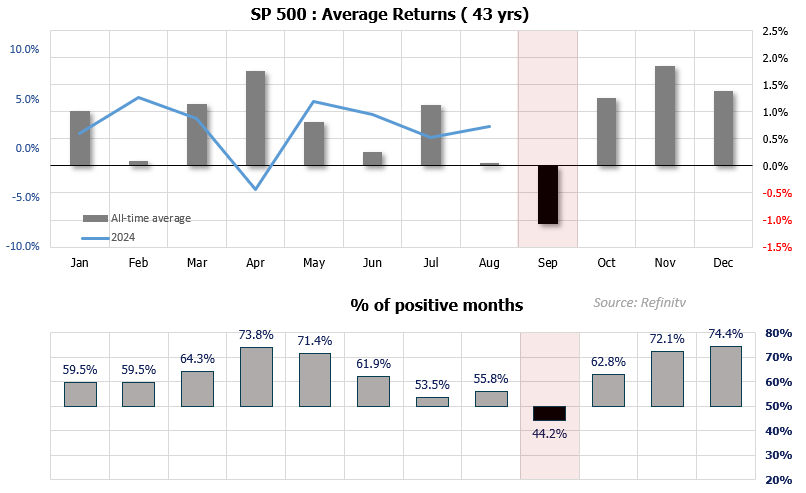
Yet a similar pattern can also be viewed on the monthly seasonality patterns, as the significant majority of months in a year have provided positive returns for global indices. However, the month that stands out is clearly September, as it is the only month to average negative returns for all three major Wall Street indices, alongside the ASX 200, DAX, Hang Seng and CSI 300.

S&P 500 technical analysis:
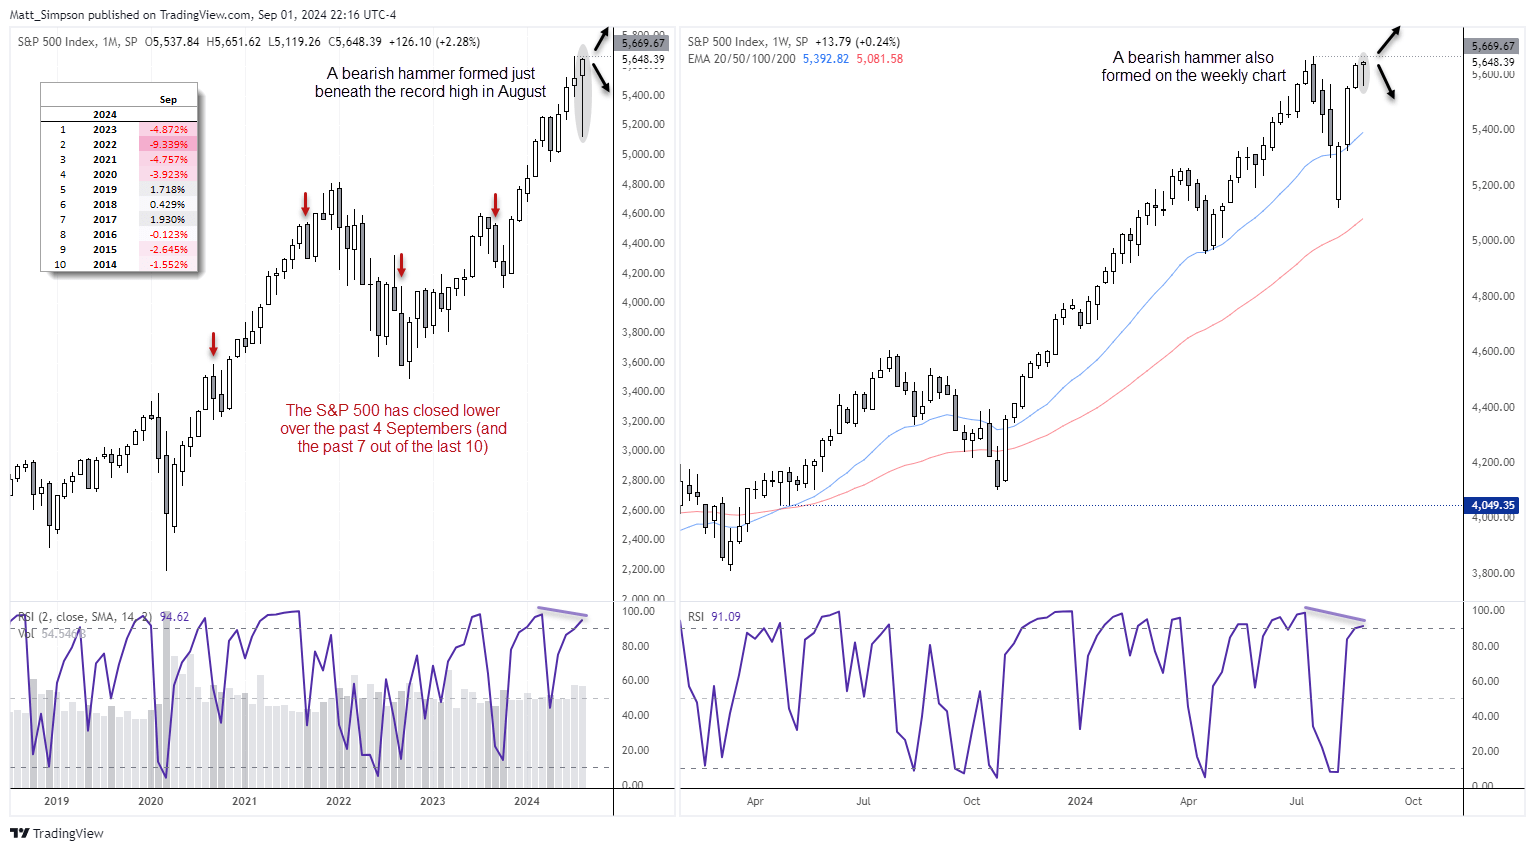
Not only does the S&P 500 average negative returns in September (-1.1%), but its win rate is just 44.2%, meaning it has closed lower 55.8% of the time. Looking through the data set also reveals that the S&P 500 has closed lower over the past four Septembers, or 7 of the last 10 years.

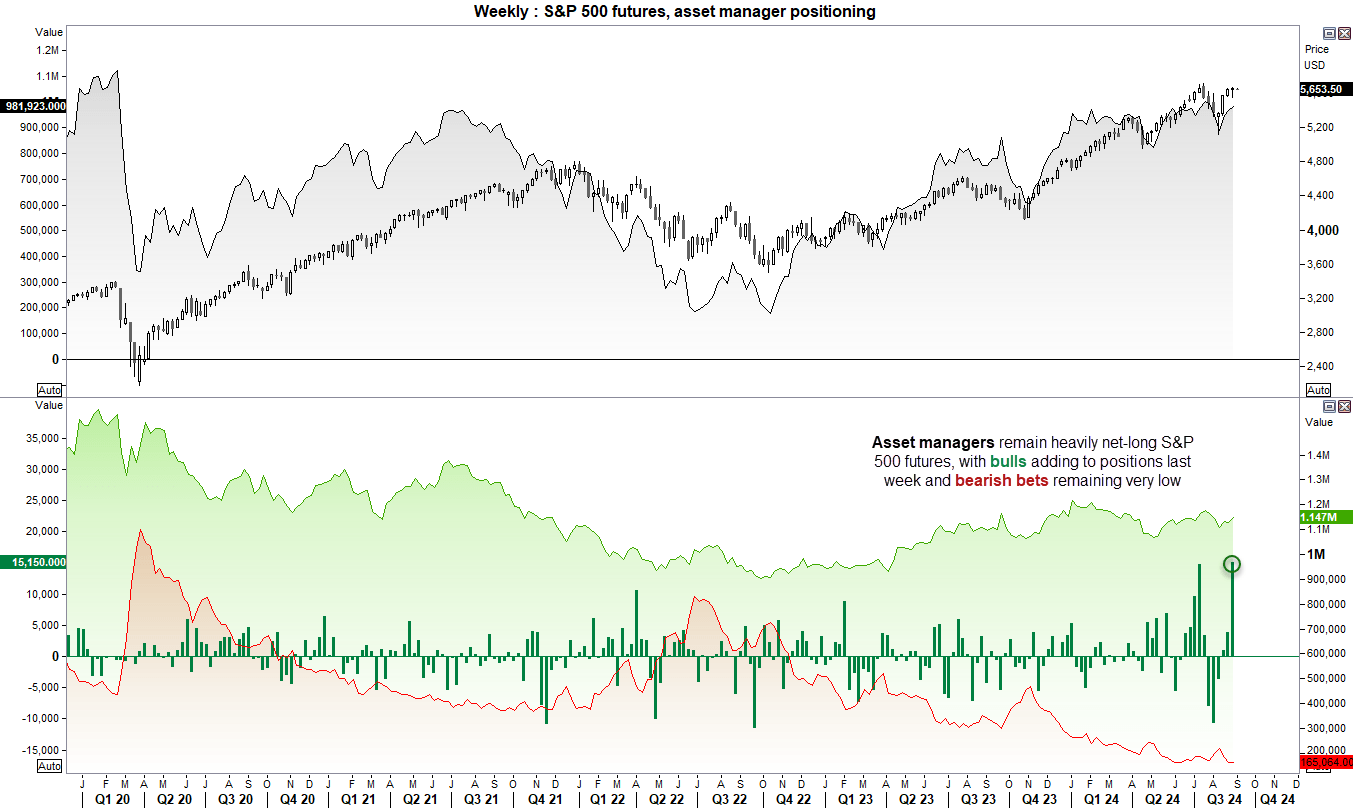
Prices are clearly in a strong uptrend, and they trade just beneath their record high. And prices seem likely to reach for a new high given how close they are to that milestone, even if it marks a false break. And as mentioned in today’s COT report, asset managers remain defiantly long S&P 500 futures.

However, an elongated hammer formed in August, and a hammer also formed on the weekly chart. A slight bearish divergence is also forming on the monthly and weekly RSIs to warn of a hesitancy to break immediately higher.
Take note that we’ll be off to a quiet start to the week with the US on public holiday. But there is plenty of data lined up to spark volatility around these highs as the week progresses, which wil ultimately dictate which way the S&P 500 moves next.

Incoming data form the US is key to drive sentiment
For Wall Street indices such as the S&P 500 to continue reaching hew highs, incoming data needs to justify expectations of a soft landing alongside multiple Fed cuts. This means inflation data cannot pick up its pace, and employment data needs to gradually soften. The worst-case scenario for bears (and best for bears) is to see employment data roll over and inflation rise as this points to higher rates into a weaker economy.
Traders will therefore keep a close eye on employment reports such as job openings, ADP payrolls, NFP payrolls and the ISM manufacturing and services PMIs this week to decipher the Fed’s, appetite for risk and the general market’s direction.
-- Written by Matt Simpson
Follow Matt on Twitter @cLeverEdge


