Silver Technical Forecast: XAG/USD Weekly Trade Levels
- Silver breakout extends more than 14.5% off monthly low- key technical resistance in view
- XAG/USD risk for exhaustion / price inflection into monthly cross- broader outlook remains constructive
- Resistance 35.24-36.01 (key), 37.50/83, 41.36– Support 32.53, 31.49, 29.86-30.09 (key)
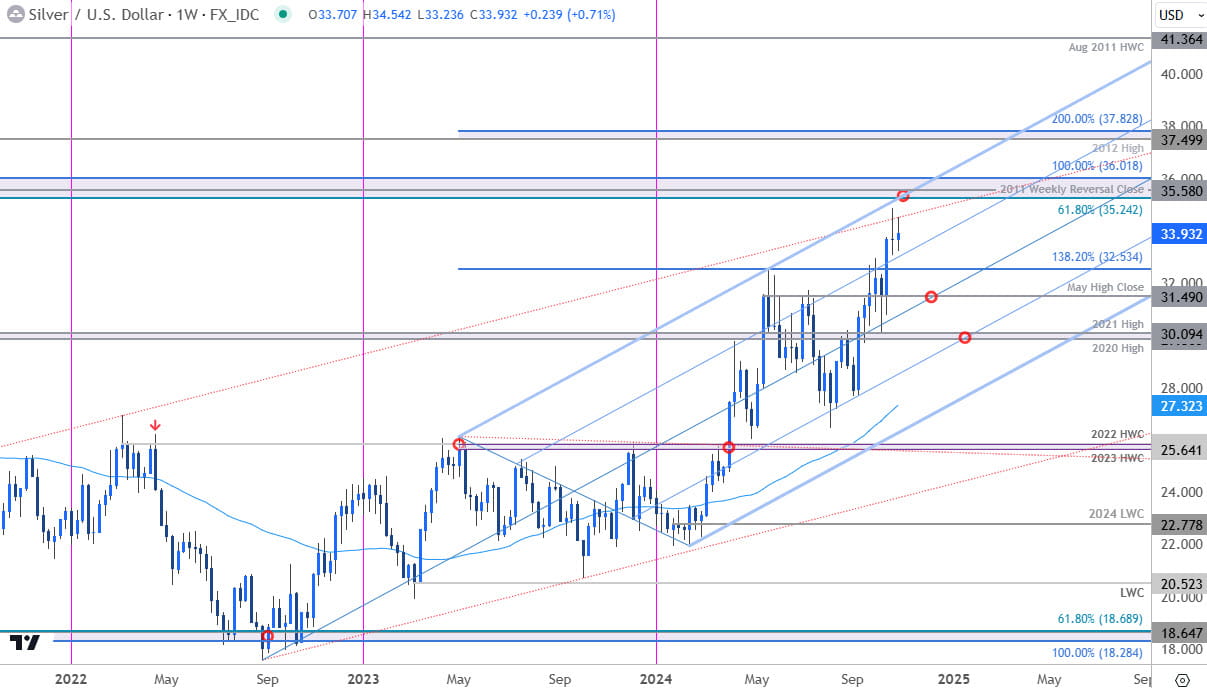
Silver prices have surged more than 46% since the start of the year with the recent breakout in XAG/USD now approaching long-term technical resistance. The focus is on a reaction into this key zone in the weeks ahead with the broader multi-year advance vulnerable into the monthly cross. Battle lines drawn on the silver weekly technical chart.
Review my latest Weekly Strategy Webinar for an in-depth breakdown of this silver setup and more. Join live on Monday’s at 8:30am EST.Silver Price Chart – XAG/USD Weekly

Chart Prepared by Michael Boutros, Sr. Technical Strategist; XAG/USD on TradingView
Technical Outlook: Silver prices have rallied nearly 32% off the August low with the multi-month advance now approaching a major technical confluence at 35.24-36.01 – a region defined by the 61.8% retracement of the 2011 decline, the 2011 May weekly reversal close, and the 100% extension of the 2020 rally. Note that a last week’s Doji candle highlights the threat for potential exhaustion / price inflection into this region with the broader outlook vulnerable while below the upper parallels.
Initial weekly support now rests with the May high / 1.382% extension of the 2022 advance at 32.53 and is backed by the May high-close at 31.49. Broader bullish invalidation rests with the 2020 /2021 highs at 29.86-30.09- losses below this threshold would suggest a more significant high was registered.
A topside breach / close above 36.01 would threaten another accelerated advance with subsequent resistance objectives eyed at the 2012 high / 200% extension at 37.49/83 and the August 2011 high-week close at 41.36.
Bottom line: The silver rally is now approaching confluent uptrend resistance and while the broader outlook remains constructive, the immediate advance may be vulnerable into the close of the month. From a trading standpoint, a good zone to reduce portions of long-exposure / raise protective stops- losses should be limited o the median-line / 34.49 IF price is heading higher on this stretch with a close above 36.01 needed to fuel the next leg of the advance.
Active Weekly Technical Charts
- Japanese Yen (USD/JPY)
- Crude Oil (WTI)
- Canadian Dollar (USD/CAD)
- Euro (EUR/USD)
- British Pound (GBP/USD)
- US Dollar Index (DXY)
- Australian Dollar (AUD/USD)
- Gold (XAU/USD)
--- Written by Michael Boutros, Sr Technical Strategist with FOREX.com
Follow Michael on X @MBForex


