US Dollar Talking Points:
- The widely-anticipated start of the FOMC’s rate cutting cycle is expected to begin tomorrow at 2PM ET, and as of this writing, markets are looking for the Fed to make a larger move with a 50 bp cut.
- Given the backdrop it seems more sensible to me to start with 25 bps which can be supported with a more-dovish dot plot matrix. But this is a Fed that’s seemed hesitant to disappoint markets and expectations so 50 very much remains a possibility. The reactions to that, however, could be visible in markets like USD/JPY and US Treasury rates, as I expanded upon in the below webinar.
- This is an archived webinar and you’re welcome to join the next: Click here for registration information.
Tomorrow is the big day with the widely-anticipated start of the FOMC rate cutting cycle. Markets have built-in the expectation for a 50 bp move tomorrow and I talked about that at-length in the webinar. So, rather than re-hash that, I want to go over some of the key charts from that session.
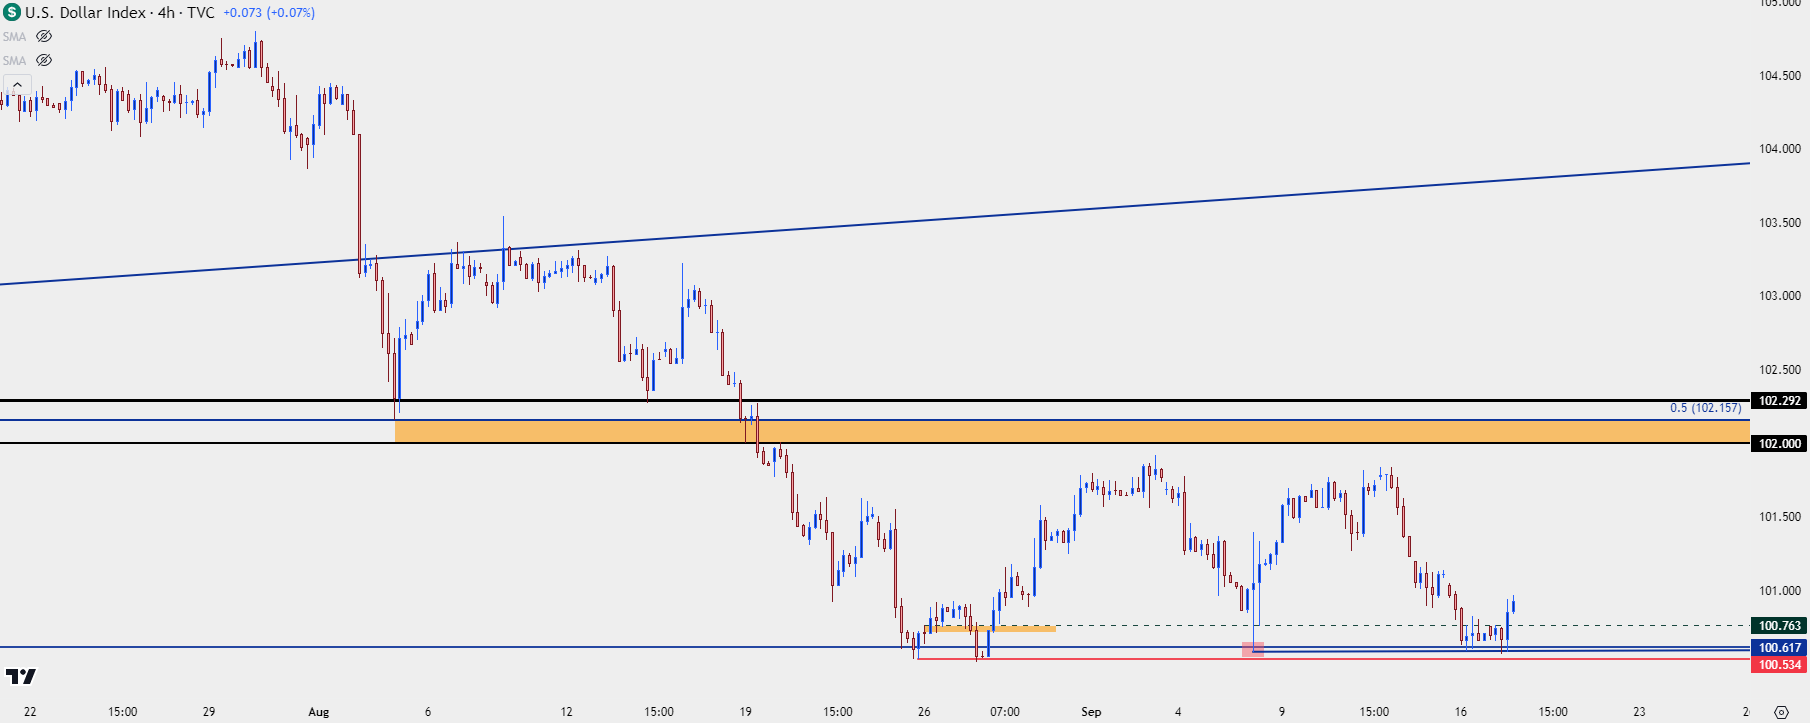
The USD continues to grind into support while still holding above the August swing-low, when the weekly RSI reading for DXY had pushed into oversold territory for the first time since January of 2018.
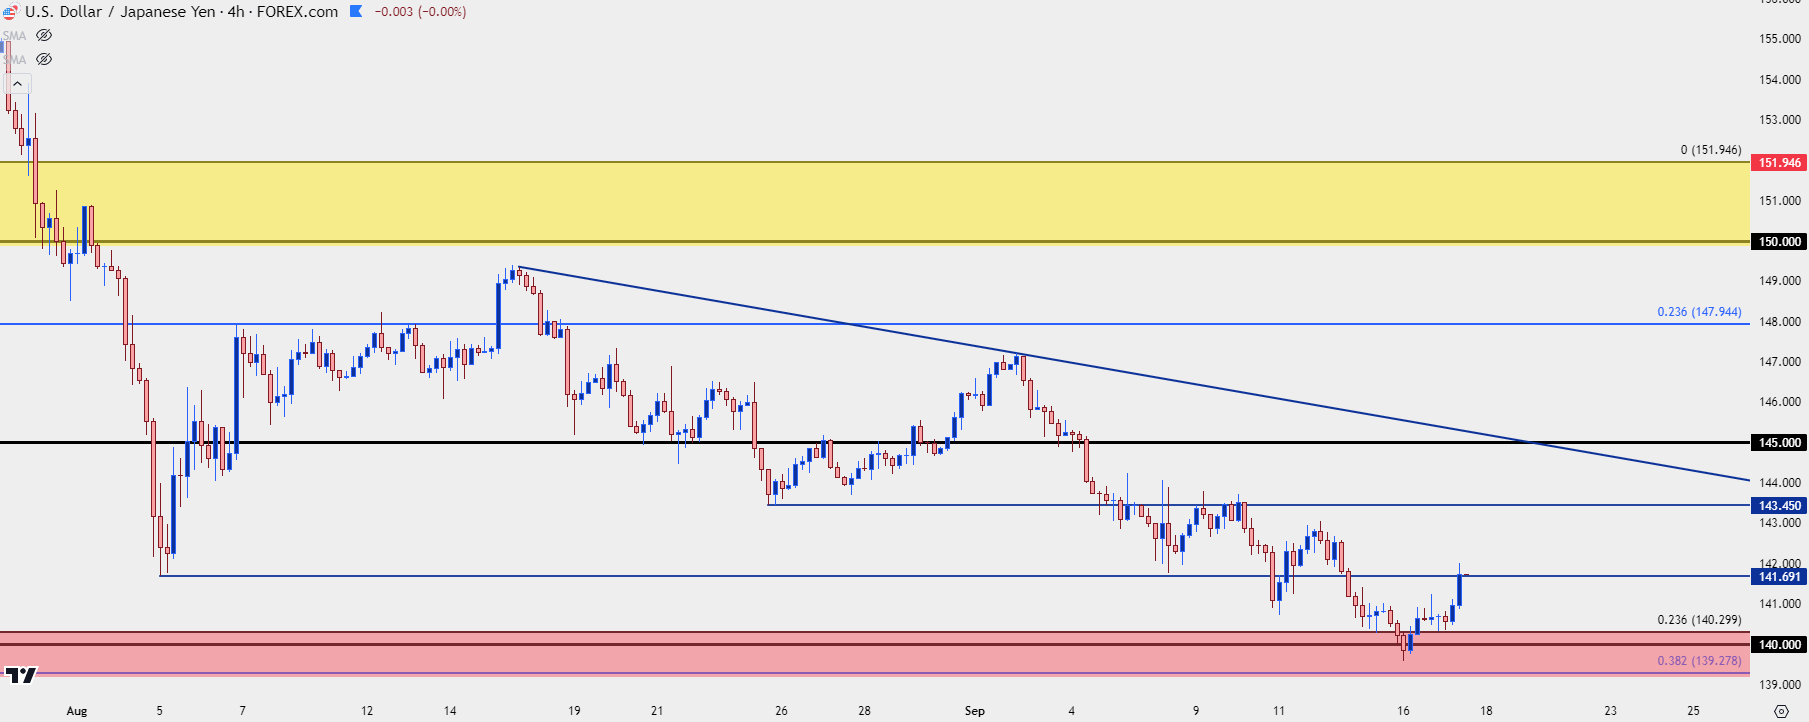
As I talked about in the webinar, I think USD/JPY will have a big push point here: A more dovish Fed provides more reason for carry trades to unwind which could add downward pressure on the Greenback. If the Fed takes a more prudent path, however, there could reasonably be some short-covering after the failed break below 140.00 yesterday.
US Dollar, DXY Four-Hour Price Chart
 Chart prepared by James Stanley; data derived from Tradingview
USD/JPY
At this point USD/JPY hasn’t yet tested the 38.2% Fibonacci retracement of the 2021-2024 major move, a trend produced by the carry trade in the pair. This implies to me that there’s more room to go if we are going to see greater carry unwind.
That doesn’t mean that the move will price-in with a linear movement lower, however, as fundamentals aren’t a direct push-point for price and supply and demand. I looked at this yesterday and we’ve since seen a bounce from the 140.00 psychological level and price is testing that first spot of lower-high resistance potential that I looked at in yesterday’s article.
If the Fed hits the dovish side heavy tomorrow, then the carry argument grows even weaker, and this could compel even more big-picture unwind. On the more prudent path, however, there could reasonably be more of a short-covering type of scenario. For that, I’m tracking resistance points at 143.45 and 145.00, which is nearing confluence with a bearish trendline.
USD/JPY Four-Hour Price Chart
 Chart prepared by James Stanley, USD/JPY on Tradingview
EUR/USD
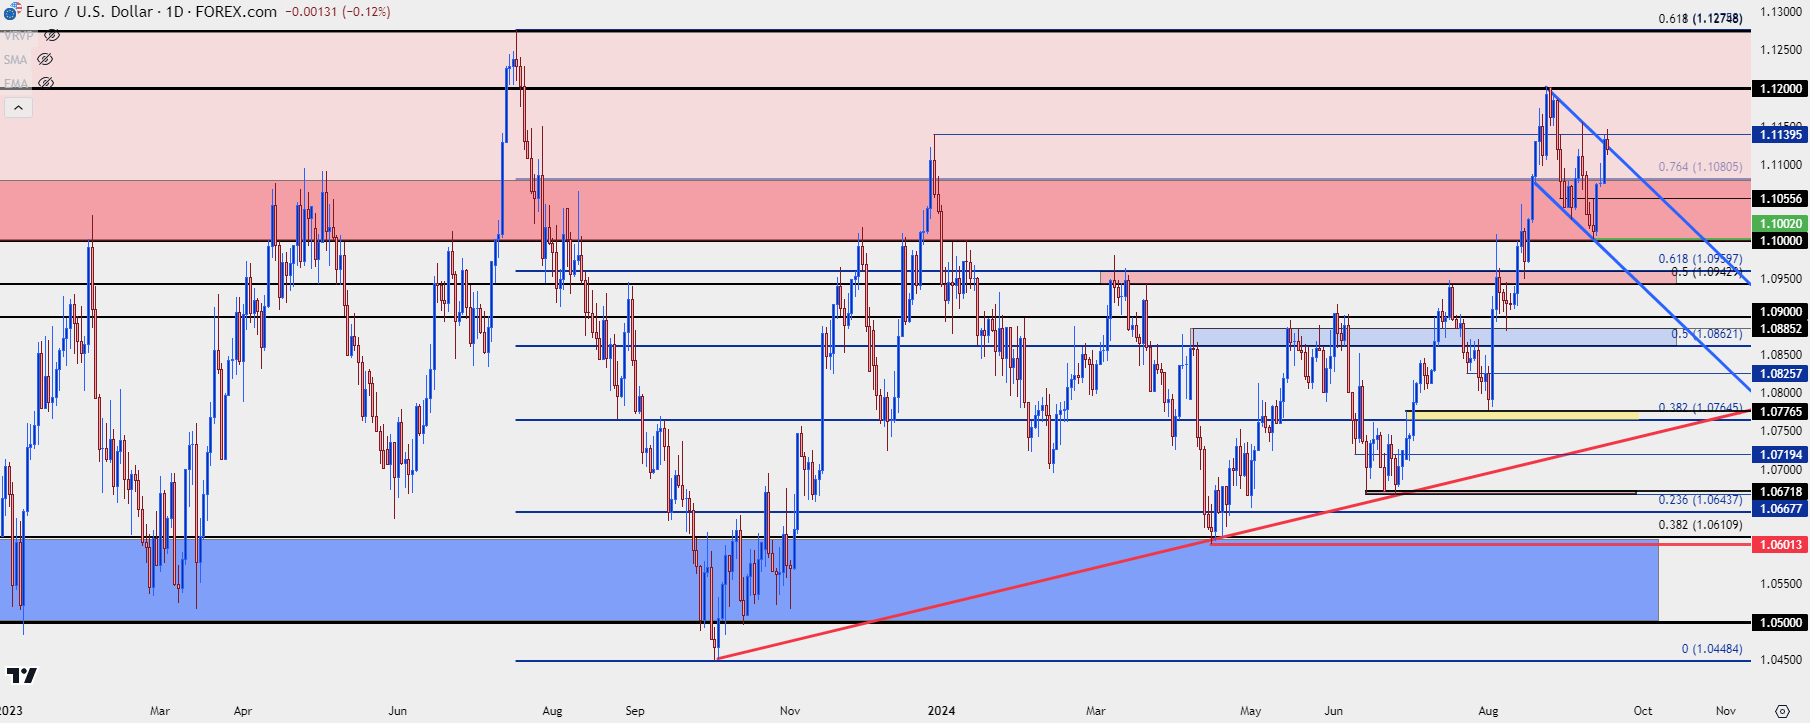
For USD-strength scenarios, I still like EUR/USD as the argument can be made that the pair remains within the longer-term range. The 1.1140 level that I’ve been tracking has come into play to help hold near-term resistance and last week’s rate cut rally has helped to further build a bull flag formation.
The 1.1000 level remains big here as bulls stepped in a couple pips shy of a re-test last week. There’s also the 1.0943 level that’s of contention and this is a possible spot of a bear trap scenario. As shared in the webinar, I’d like to see a closed body-break of that price on the daily chart to illustrate mean reversion for range scenarios in the pair.
EUR/USD Daily Price Chart
 Chart prepared by James Stanley, EUR/USD on Tradingview
--- written by James Stanley, Senior Strategist


