Final manufacturing PMIs released near the 1st of each month don’t have much of an impact on markets, as they are usually little changed from the PMI Flashes, released around the 20th each month. However, China’s Caixin Manufacturing PMI and the US Manufacturing ISM do have an impact, as it the first time the markets get to view the manufacturing data. Today’s release of the Caixin Manufacturing PMI for July was 50.3, just above the expansion/contraction level of 50, vs 51 expected and 51.3 in June. In addition, the US ISM Manufacturing PMI for July was 59.5 vs 60.4 expected and 60.6 in June. This was the weakest print in 6 months.
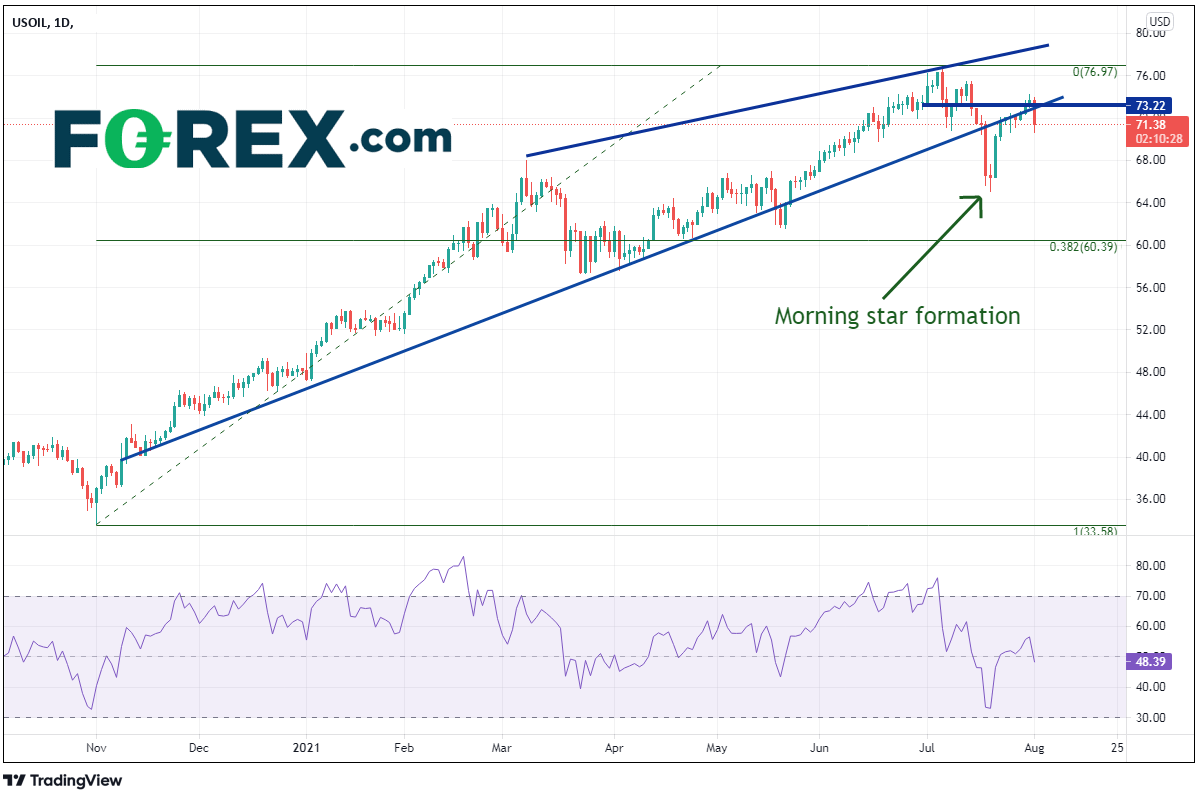
As a result of the slowdown in manufacturing in the worlds 2 largest economies, crude oil took at hit. US OIL was down over 3.3% today on worries of lower demand due to slower manufacturing and the delta variant of the coronavirus making its rounds. On a daily chart, US OIL has been moving higher since putting in a local low near November 2nd, 2020 near 33.67. On March 8th, the trend higher began forming an ascending wedge, which reached a high of 76.95 on July 6th. On July 19th, Crude Oil broke aggressively below the wedge, only to reverse 2 days later. This 3-candlestick reversal formation is known as a Morning Star formation. On Friday, price closed back within the wedge, only to fail today. Strong resistance is above at the bottom trendline of the channel and horizontal resistance near 73.22. If price breaks above there, it can test the recent highs at 76.95, and then the upper trendline of the wedge near 79.00. After failing to hold above resistance today, Crude can fall to the July 20th lows at 65.11, then the 38.2% Fibonacci retracement level from the November 2nd, 2020 lows to the July 6th highs, near 60.39.

Source: Tradingview, Stone X
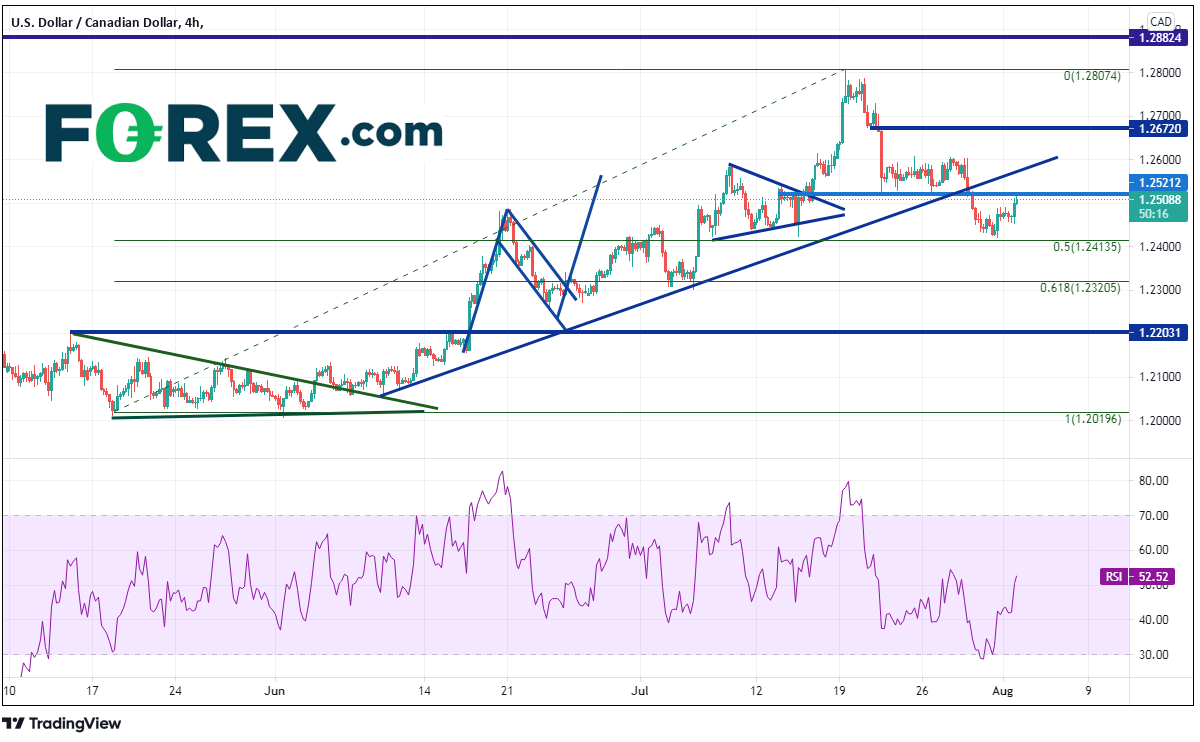
USD/CAD trades inversely to Crude Oil. As a result of the sell off in Crude today, USD/CAD moved higher, from 1.2468 to a high of 1.2515. However, the 240-minute shows that after retracing 50% of the move from the low on March 18th to the high on July 19t near 1.2414, the pair bounced. USD/CAD is banging it head against horizontal resistance at 1.2512. Resistance above is that the upward sloping trendline from the June 9th lows near 1.2570. Above there is horizontal resistance near 1.2672. Support is at the recent lows near 1.2414, the 61.8% Fibonacci retracement level from the previously mentioned timeframe near 1.2320. Additional horizontal support is at 1.2320.

Source: Tradingview, Stone X
With little movement in the US Dollar today, the move higher in USD/CAD can be attributed to the selloff in Crude Oil. The move lower in oil may have been due to fears of lack of demand. Don’t forget the API reports on Tuesday and the EIA reports on Wednesday! If they show a build in inventories, the moves we had today could continue.


