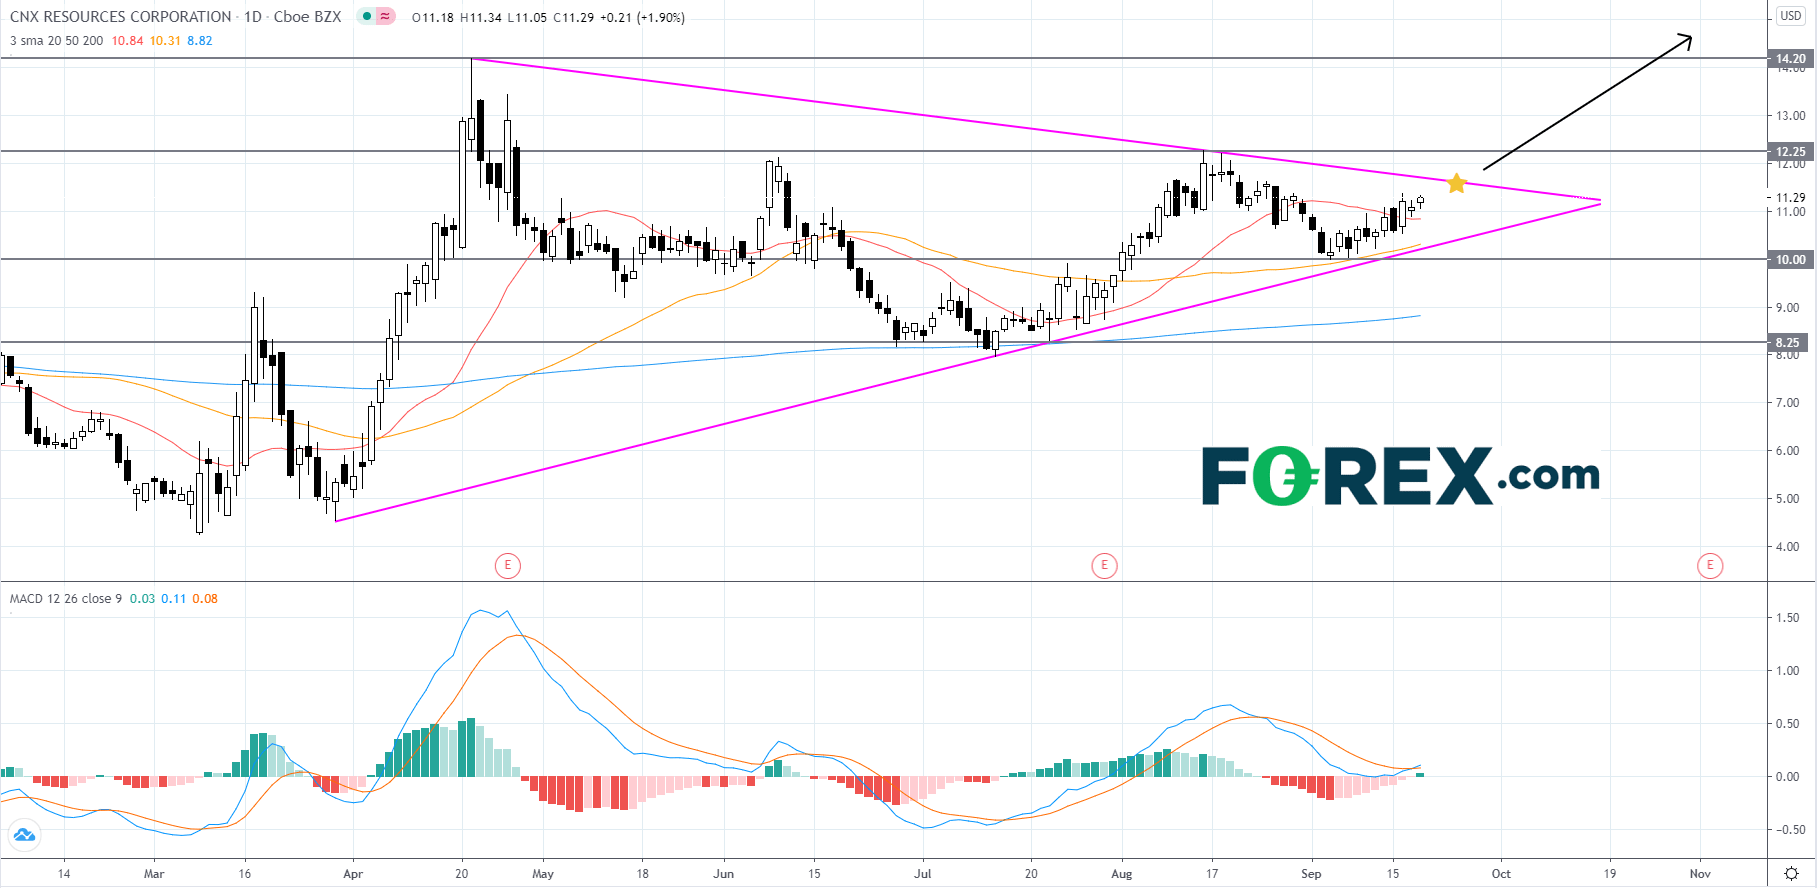
CNX Resources (CNX), an independent oil and natural gas company, is currently consolidating inside of a symmetrical triangle pattern that price has been holding within since late-March of 2020. On Thursday, September 17th, the MACD line crossed above the signal line, a bullish indicator. At the beginning of September the price of oil experienced a steep drop before finding support around $36.00 and rebounding. Since oil companies are intimately tied to the price of oil, the bounce brought the majority of oil companies up with it.
Price will likely continue to consolidation for a little while longer before it reaches the upper trendline of the pattern. A symmetrical triangle pattern is considered to be continuation pattern, therefore price will probably reach the upper trendline and breakout to the upside. Price will then likely advance to its first resistance level of 12.25, break through it and continue climbing towards its 2020 peak of about 14.20. If price manages to reach 14.20, it could potentially go further. On the other hand, if price breaks out from the lower trendline, it would be a bearish signal and price would likely fall to its first support level at 10.00. If price cannot bounce off of the 10.00 level, then it could break down further to its second support level at 8.25.

Source: GAIN Capital, TradingView
Price will likely continue to consolidation for a little while longer before it reaches the upper trendline of the pattern. A symmetrical triangle pattern is considered to be continuation pattern, therefore price will probably reach the upper trendline and breakout to the upside. Price will then likely advance to its first resistance level of 12.25, break through it and continue climbing towards its 2020 peak of about 14.20. If price manages to reach 14.20, it could potentially go further. On the other hand, if price breaks out from the lower trendline, it would be a bearish signal and price would likely fall to its first support level at 10.00. If price cannot bounce off of the 10.00 level, then it could break down further to its second support level at 8.25.

Source: GAIN Capital, TradingView
Latest market news
Today 01:12 PM
Today 10:00 AM
Today 08:21 AM


