New Zealand Dollar Outlook: NZD/USD
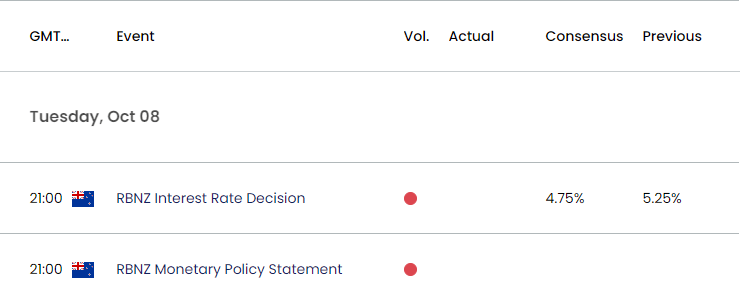
NZD/USD is on the cusp of testing the September low (0.6107) as it slips to a fresh monthly low (0.6108), and the Reserve Bank of New Zealand (RBNZ) meeting may keep the exchange rate under pressure as the central bank is expected to lower the official cash rate (OCR) for the second time this year.
NZD/USD on Cusp of Testing September Low Ahead of RBNZ Rate Decision
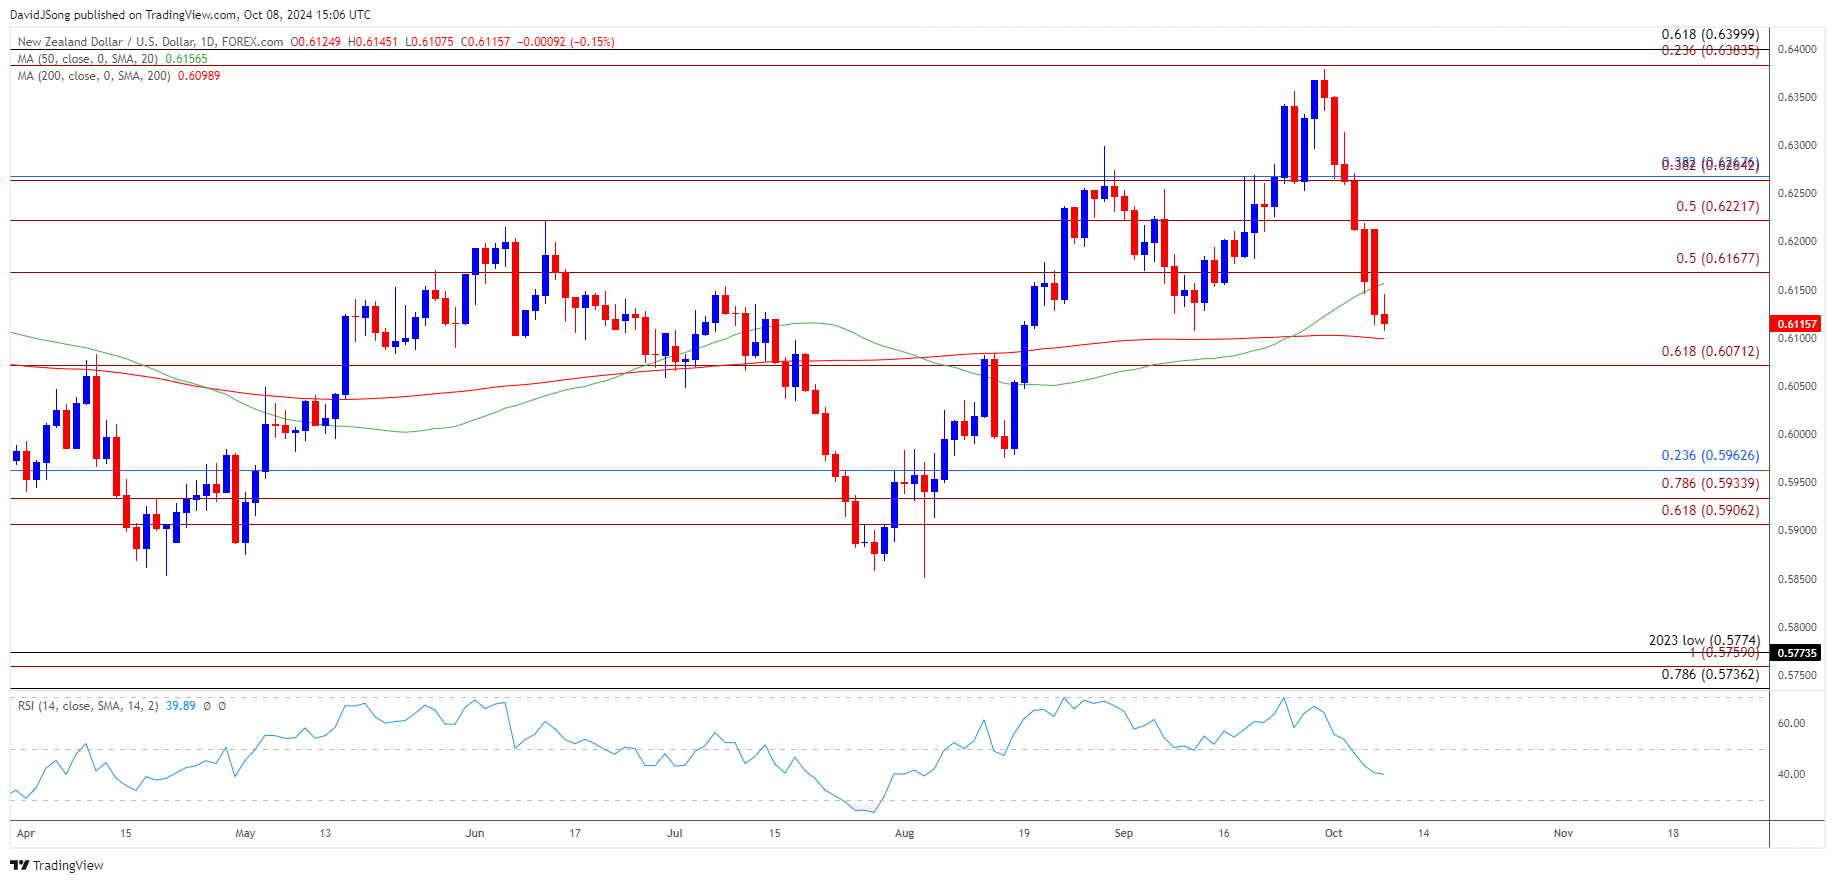
Keep in mind, the recent selloff in NZD/USD emerged following the failed attempt to test the July 2023 high (0.6412), with the weakness in the exchange rate keeping the Relative Strength Index (RSI) out of overbought territory.
Join David Song for the Weekly Fundamental Market Outlook webinar. David provides a market overview and takes questions in real-time. Register Here
In turn, NZD/USD may struggle to retain the advance from the yearly low (0.5850) as the RSI falls to its lowest level since August, and the RBNZ meeting may drag on the New Zealand Dollar as the central bank is expected to implement a 50bp rate cut.
New Zealand Economic Calendar

It seems as though the RBNZ will continue to alter the course for monetary policy as the central bank projects ‘the OCR to decline over time,’ and it remains to be seen if Governor Adrian Orr and Co. will further unwind its restrictive policy at its last meeting for 2024 as ‘the OCR needs to decline sooner than previously assumed, in order for inflation to sustainably settle at the 2 percent target midpoint in the medium term.’
With that said, NZD/USD may continue to carve a series of lower highs and lows should the RBNZ retain a dovish forward guidance, but the exchange rate may attempt to retrace the decline from the start of the month if the central bank delivers a hawkish rate cut.
NZD/USD Price Chart – Daily

Chart Prepared by David Song, Strategist; NZD/USD on TradingView
- NZD/USD extends the decline from the September high (0.6379) to mark the longest selloff since August 2023, with a breach below the September low (0.6107) raising the scope for a move towards 0.6070 (61.8% Fibonacci extension).
- A break/close below the 0.5910 (61.8% Fibonacci extension) to 0.5960 (23.6% Fibonacci retracement) region opens up the yearly low (0.5850) but NZD/USD may stage a rebound should it defend the September low (0.6107).
- Need a move above the weekly high (0.6213) for NZD/USD to negate the bearish price series, with a break/close above the 0.6220 (50% Fibonacci extension) to 0.6270 (38.2% Fibonacci retracement) bringing the monthly high (0.6351) on the radar.
Additional Market Outlooks
US Dollar Forecast: USD/CAD Rally Eyes September High
AUD/USD Forecast: RSI Continues to Move Away from Overbought Zone
EUR/USD Vulnerable on Close Below 50-Day SMA
USD/JPY Outlook Mired by Negative Slope in 50-Day SMA
--- Written by David Song, Senior Strategist
Follow on X at @DavidJSong


