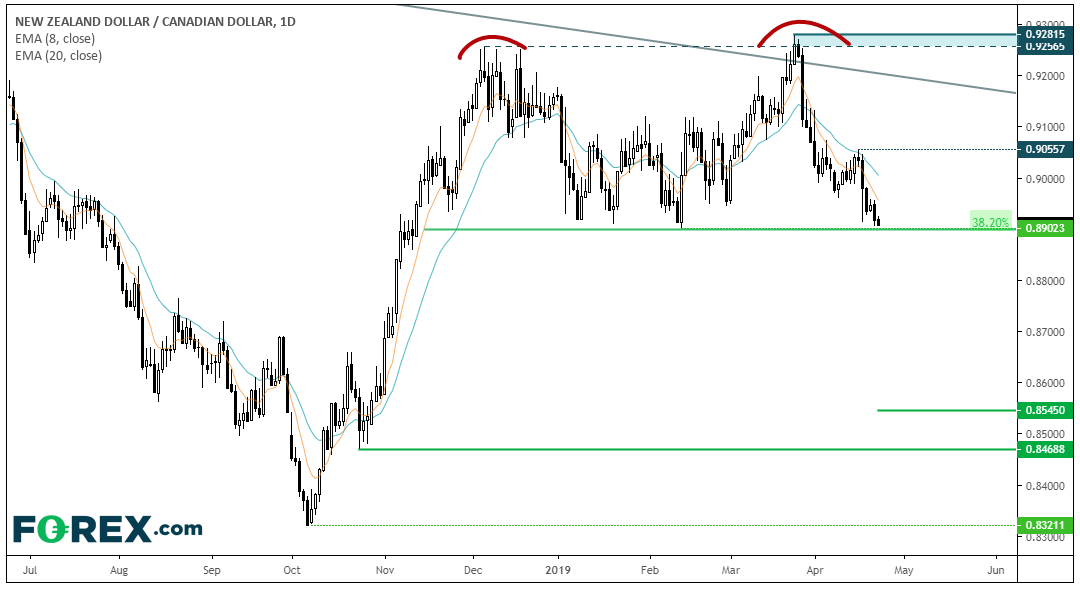
We can see on the daily chart that momentum since the March high is predominantly bearish and we’ve seen a nice pullback into the averages before accelerating lower again. Prices are currently hovering above 89c, which is right on a 38.2% Fibonacci level. If prices are to break lower (and they appear eager to do so…) we’re essentially looking at a double top pattern. If successful, the pattern projects and approximate target around 85.45.
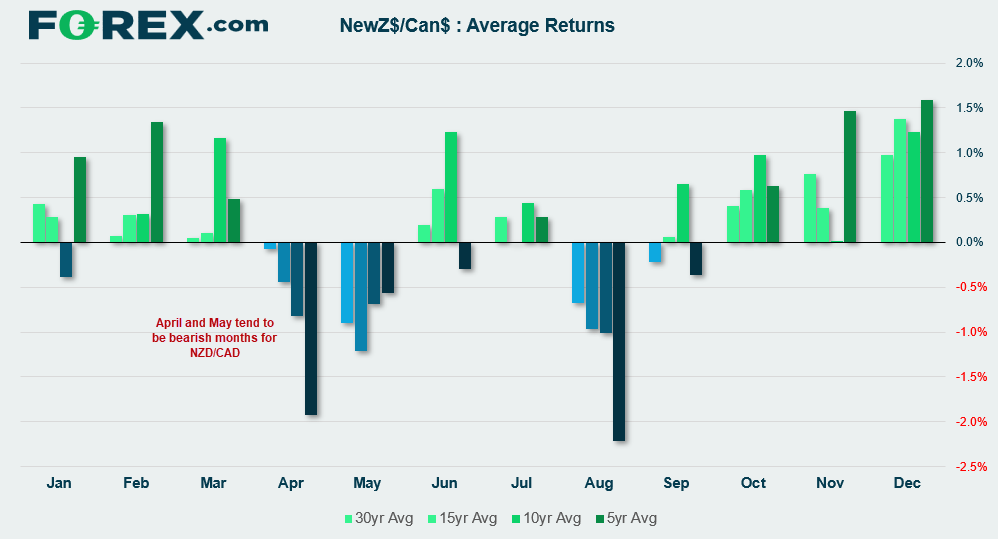
Seasonally, April and May tend to be bearish months for NZD/CAD and price action is doing its upmost to maintain this tendency. Furthermore, price structure on the weekly chart points to the potential for further downside if incoming data (and CB meetings) allow.
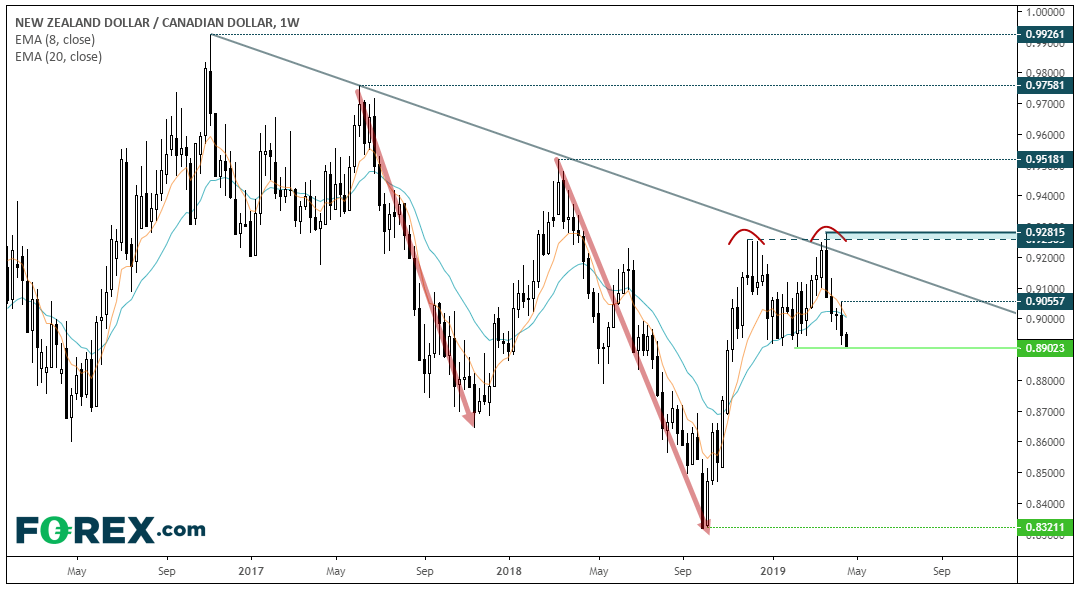
It’s when we look at the weekly chart we begin to appreciate its downside potential and the significance of the 2016 trendline. A bearish engulfing week marked a failed attempt to break above it and take it back in line with the longer-term bearish trend. Moreover, the 8-week eMA is on the verge of crossing beneath the 21-week eMA. And, as price action is now testing key support of its 5-month double top, we think this pair is well worth monitoring, given the depth of the prior swing within its downtrend.


