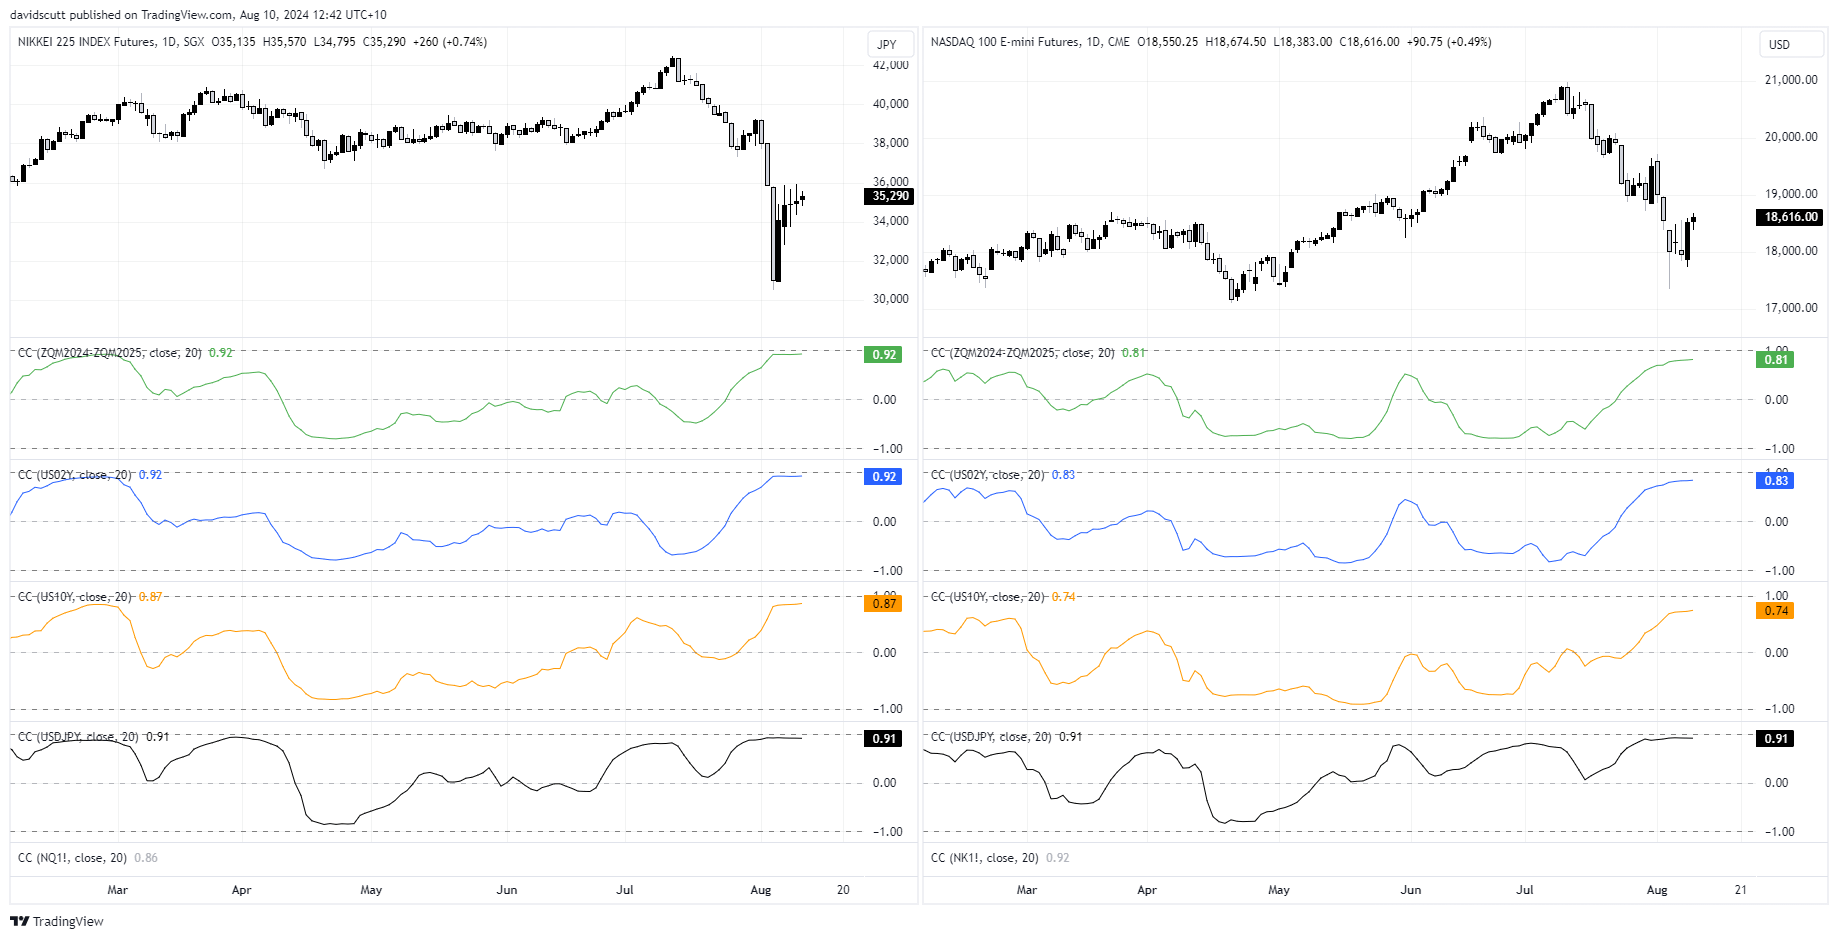
- Nasdaq 100 and Nikkei 225 futures were highly correlated with short-dated US bond yields last week
- It implies sentiment towards the US economic outlook is influencing their performance
- Should the relationship remain, CPI, PPI and retail sales data may influence direction in the week ahead
Nasdaq 100 and Nikkei 225. They may be poles apart geographically and their composition, but these two momentum-driven markets have morphed into avid US economic watches over the past month, acting as proxies for investor sentiment. For so long the tail was wagging the dog, but now the dog is back in charge. That means if you want to get clues on directional risks next week beyond price signals, you better pay attention to the US economic calendar.
Economic sentiment influencing movements
To provide context around the view above, it’s useful to see what Nasdaq 100 and Nikkei 225 futures have been influenced by recently. The chart below looks at the rolling daily correlation both markets have had with year-ahead Fed rate cut expectations in green, US two-year bond yields in blue, US 10-year bond yields in yellow and USD/JPY in black over the past month.

Source: TradingView
Regardless of which market, the scores with every variable have been positive and strengthening over this period, especially shorter-dated US rates and USD/JPY which has been acting as a risk appetite proxy thanks to shifts in carry trades.
While correlation does not necessarily mean causation, when it comes to the strength with shorter-dated US interest rates, I’m confident they have been a major influence, reflecting sentiment among traders as to just how much the Fed will have to cut rates over the next year. The more that’s been priced in, the greater the implied risk the US is heading for a hard economic landing, and vice versus.
Risk events ramp up this week
If Nasdaq and Nikkei traders are being influenced by perceptions towards the US economy, it means you need to be across what data carries the potential to shift sentiment meaningfully, as we saw with jobless claims and ISM services last week.
This week is far more important, containing key consumer price inflation data on Wednesday, upstream producer price inflation on Tuesday, along with retail sales on Thursday. The major event calendar, with market expectations, is found below. All times US EDT.

Source: TradingView
As the largest part of the US economy, it goes without saying that an upside surprise for retail sales will bolster confidence that a soft economic landing can be achieved, likely boosting the Nasdaq and Nikkei should existing correlations hold. It’s not on the table, but markets are looking for a 0.3% increase with core sales expected to come in slightly softer at 0.2%.
The inflation prints are a bit more nuanced, with ice-cold numbers likely to fan concerns that demand is faltering. An ideal outcome would be to see continued moderation relative to the hot readings earlier this year, clearing the way for the Fed to cut rates because of easing inflation, not a collapse in economic activity.
Nasdaq 225 technical picture
Source: TradingView
Unlike other prominent indices, Nasdaq 100 futures remain in an uptrend despite wobbles earlier in the week, bouncing off support dating back to the start of 2023 on Monday. Over the remainder of the week, futures attracted bids beneath the 200-day moving average, absorbing big selling pressure at the time. That was enough for me to look at a long setup which worked thanks to a larger-than-expected decline in initial jobless claims on Thursday.
Friday’s doji candle provides no obvious signal on directional risks, although it’s noteworthy the rebound over the last two days came on diminishing volumes. That’s a red flag for bulls. However, with RSI (14) through its downtrend, bearish momentum looks to be ebbing. It hasn’t happened yet, but it looks like MACD may soon confirm the signal.
To get constructive about a sustained push higher, the price would need to break the intersection of the downtrend dating back to record highs and horizontal support at 18754.50. If that were to happen, the 50-day moving average and 19719 would be potential topside targets.
If the intersection were to hold, downside support may be found at 18,000, the 200-day moving average and January 2023 uptrend around 17,480. Below, 17165 has acted as support and resistance over the past year, making that a potential significant level.
Nikkei 225 technical picture

Source: TradingView
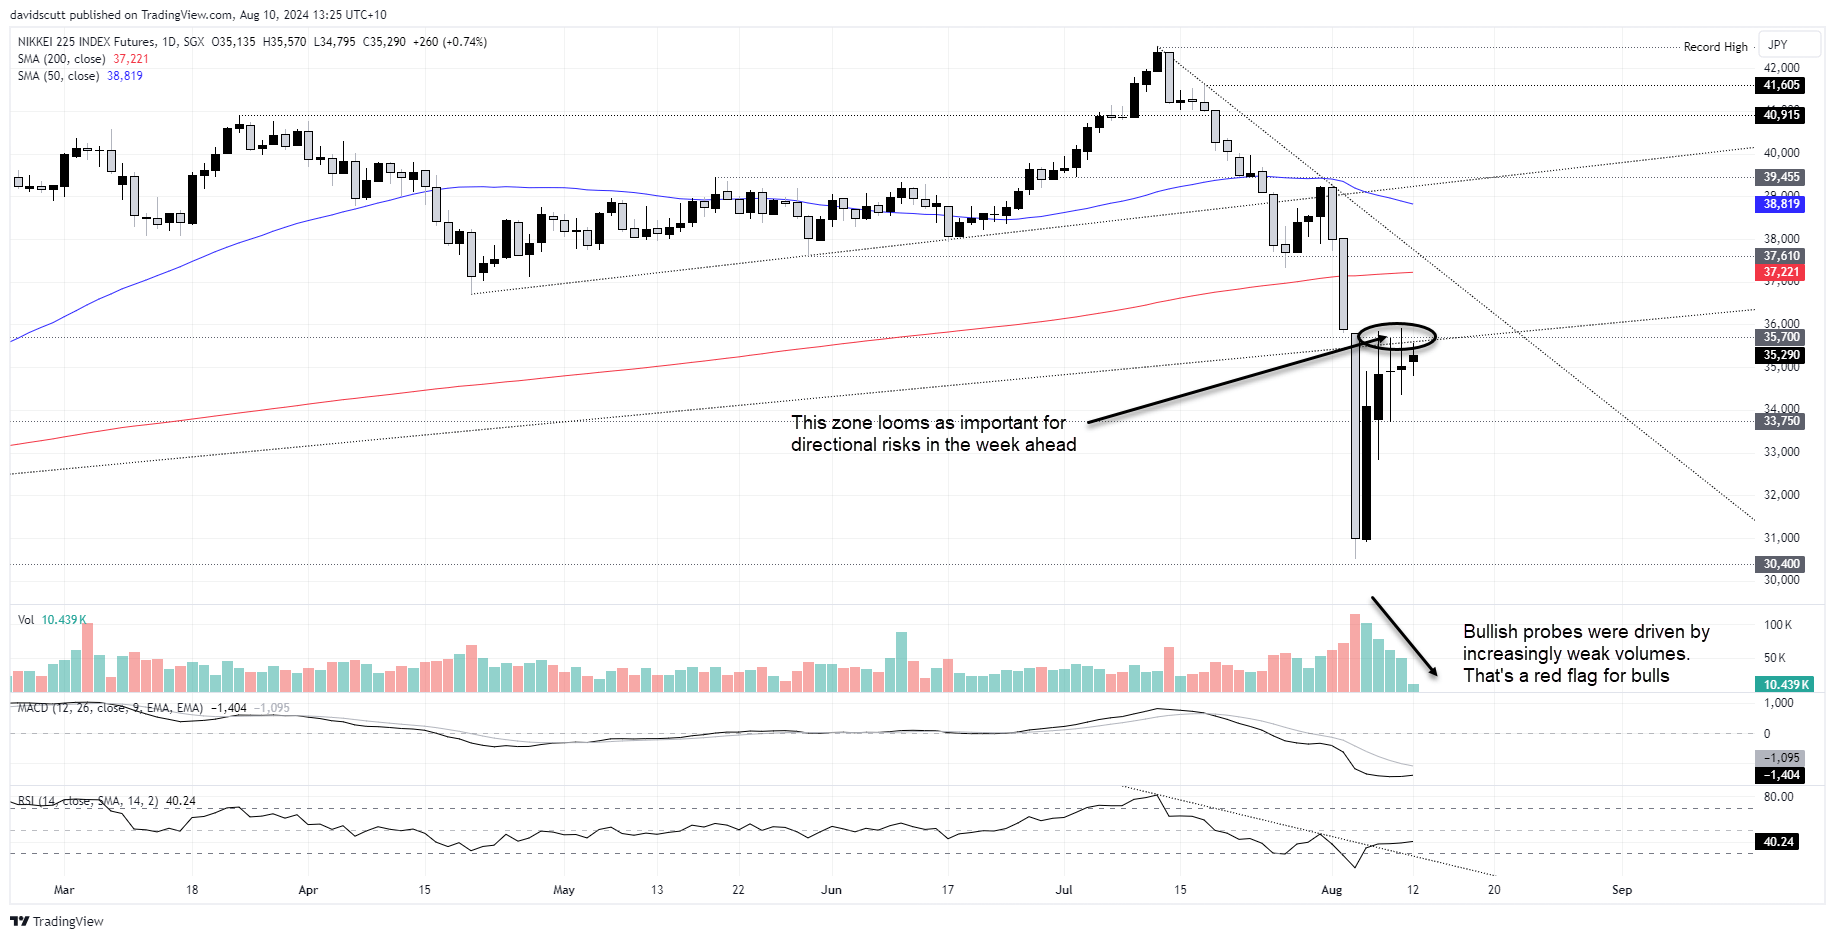
Unlike the Nasdaq, Nikkei 225 futures broke long-running uptrend support and were unable to reclaim the level despite constant attempts to do so last week. The inability to break higher should concerns bulls, especially with volumes dropping away noticeably as the week progressed.
You get the sense the price needs to break and close above 35,700 to encourage other bulls off the sideline. If it doesn’t, it may only embolden bears to seek out fresh downside. From a momentum perspective, while RSI (14) has broken its downtrend, MACD has yet to confirm the shift in bearish momentum.
A break of 35,700 would bring the 200-day moving average and 37,610 into play, along with a potential retest of the downtrend dating back to the record highs. Should 35,700 hold, 33750, Monday’s low and 30,400 are downside levels of note. Good luck!
-- Written by David Scutt
Follow David on Twitter @scutty


