Welcome to Markets 4x4, a post delivered daily by 4pm in Sydney detailing the key macro themes from the Asian session.
Here’s what you need to know for Tuesday, October 24.
Bill and Bill’s excellent short squeeze
Woah, dude. Are you now bullish bonds, too? No way! It’s remarkable how the world’s most prominent bond bears turned bullish within two hours of each other. Even more so when both decided to use their market moving clout on X, “formerly known as Twitter”, to convey their wisdom on the financial world free of charge. How nice!
Regardless of what you made of it, the “Bill’s” left their mark with the substantial bid in US Treasuries flowing through to Asian fixed income markets today. While a spectacular reversal, the scale likely reflects how bearish positioning had become in the short-term, rather than a blow-off top signaling a turning point.
For all newfound bravado conveyed by wounded bond bulls during the session, it wasn’t enough to help the Bank of Japan who were forced to step in again to cap yields with yet another unscheduled bond buying operation. For those who believe yields have topped, you may want to keep an eye on the Japanese bond market.
Bonds rip so buy the high beta FX dip
With US 2s, 10s and 30-year yields more than 15 basis points from the highs, thin volumes and a sparce events calendar provided a window for traders to squeeze FX names higher against the dollar. And accept the challenge they did. AUD was the top performer, assisted by a modest bid in US stock futures and Dalian iron ore. The Kiwi wasn’t far behind, making it a quinella for high beta FX names in Asia.
Given the risk-laden environment with major US tech earnings, a speech from the RBA Governor and fluid situation in and around the Gaza strip, flip a coin to determine whether the move in Asia will continue into European trade. One thing is certain right now, though; risk rallies don’t tend to last long.
Bitcoin finds the code for upside
Bitcoin bears have long bemoaned the token’s correlation with investments at the extremities of the risk asset spectrum. But with persistent speculation surrounding the approval of several spot bitcoin exchange traded funds (ETFs) in the US, perhaps bitcoin has finally unlocked the key attribute many investors have been looking for: negative correlation to broader market moves.
However, those hopes may need to be put on ice with bitcoin’s latest spurt – taking it back to levels not seen since May 2022 – was in response to a ticker code being generated for Blackrock’s still-unapproved spot bitcoin ETF. The four letters – IBTC – were worth around $US17 billion each for bitcoin’s market cap.
Asia’s PMIs anything but flash
‘Flash’ PMI reports from Australia and Japan were anything but in October, providing another bearish signal on the global economy given their cyclical characteristics. The Australian composite figure printed at 47.3, the lowest level in nearly two years. Under the hood, the results read like chapter on stagflation in an economics textbook with elevated price pressures coinciding with decreased activity. But the key difference between now and other stagflation periods is that hiring remains robust. Perhaps this time is different, or maybe not?
Japan’s performance was only marginally better with activity going backwards for the first time this year. New orders, new export orders and backlogs fell while inflationary pressures eased, painting a very different picture to the BOJ’s upgraded views on regional activity released only last week.
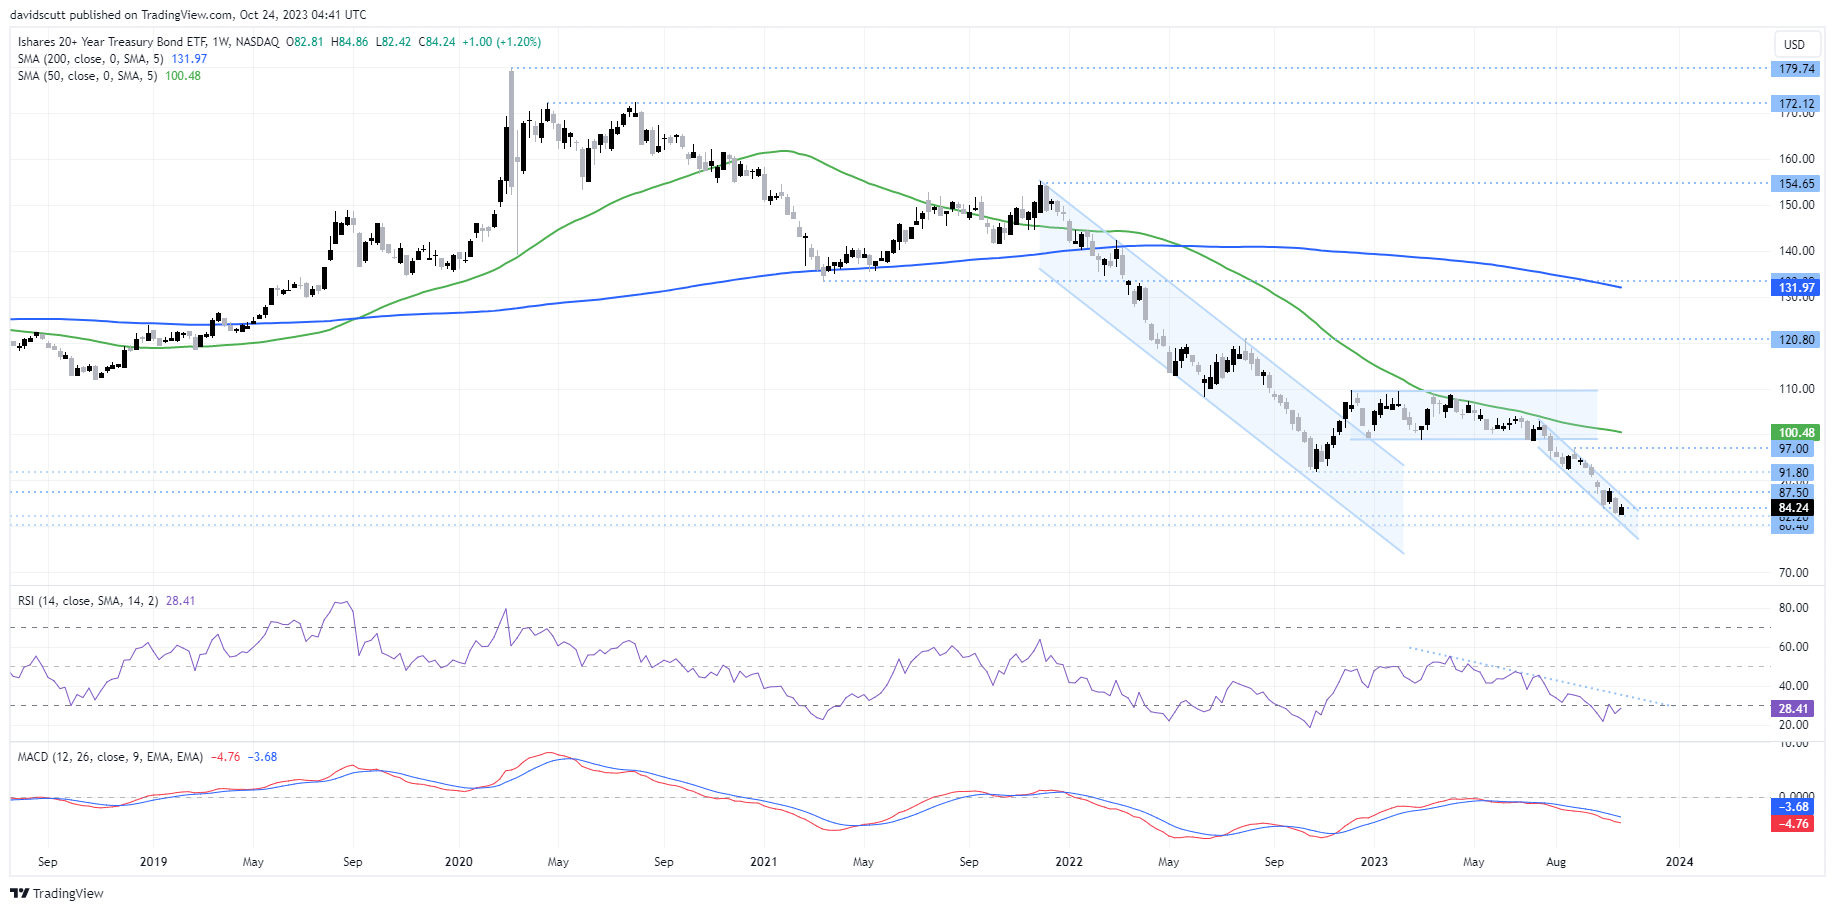
Market of the day: iShares’ 20 Plus Year Treasury Bond ETF (TLT)
With long bonds receiving plenty of attention, it’s probably a time to look at the product which arguably brought them to the masses: iShares’ 20 Plus Year Treasury Bond ETF with the ticker code ‘TLT’.
There are bear markets and then there’s the unwind in US long bonds over the past two years. It’s been brutal. But with Bill and Bill now positive towards the outlook, there’s likely to be a bit of optimism that bonds may have bottomed. That’s probably a good thing given TLT is running out of technical support levels with only $82.20 and $80.40 found below where it currently trades. $87.50 and $91.80 are the levels to watch on the topside should this latest move have legs. RSI and MACD suggest momentum remains to the downside.

-- Written by David Scutt
Follow David on Twitter @scutty


