Japanese Yen technical outlook: USD/JPY short-term trade levels
- Japanese Yen losses pile for a fourth-day as USD/JPY rallies 2.4% off May low
- USD/JPY now approaching key resistance zone around the yearly high
- Resistance 137.36/91 (key), 139.58, 140.33- support 135.75, 134.30s, 133.50/71
The Japanese Yen is poised for a fourth consecutive daily loss with USD/JPY back on the march towards the yearly highs. While the broader technical structure remains constructive, the advance may be vulnerable into key resistance just higher, and the threat elevates for possible price exhaustion / inflection into this zone. These are the updated targets and invalidation levels that matter on the USD/JPY short-term technical charts into the close April.
Review my latest Weekly Strategy Webinar for an in-depth breakdown of this USD/JPY technical setup and more. Join live on Monday’s at 8:30am EST.
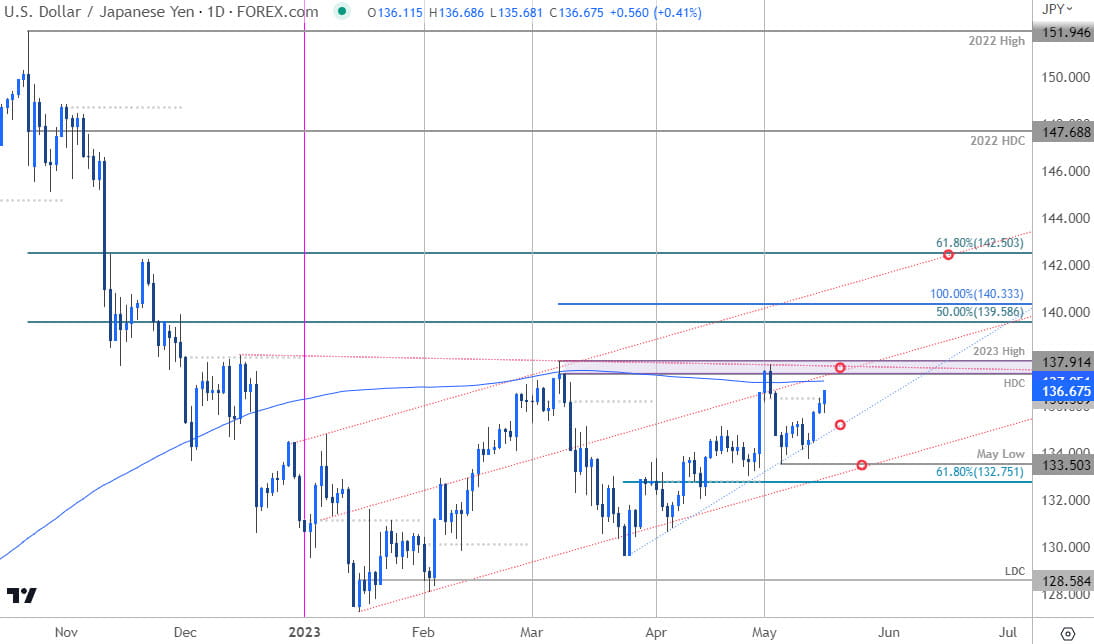
Japanese Yen Price Chart – USD/JPY Daily

Chart Prepared by Michael Boutros, Sr. Technical Strategist; USD/JPY on TradingView
Technical Outlook: In last month’s Japanese Yen short-term outlook we noted that USD/JPY was testing a key pivot zone around 135 with, “A breach / close above this threshold is needed to fuel the next leg higher in price.” USD/JPY ripped higher into the close of April with the rally faltering at key resistance around 137.36/90- a region defined by the yearly high / high-day close and converges on basic trendline resistance extending off the December highs.
Price collapsed off this threshold into the May open with a three-day decline now defining the entire monthly range. A rebound off the March support slope has broken through monthly-open resistance today with the bulls once again within striking distance of the highs.
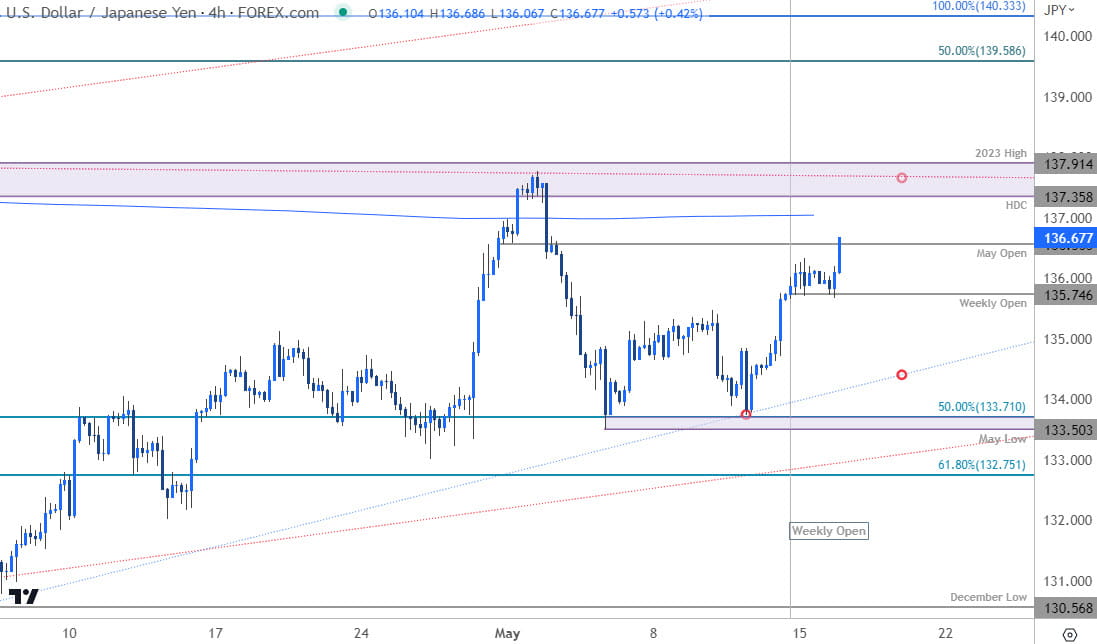
Japanese Yen Price Chart – USD/JPY 240min

Chart Prepared by Michael Boutros, Sr. Technical Strategist; USD/JPY on TradingView
Notes: A closer look at Yen price action shows the USD/JPY recovery approaching the 200-day moving average near ~137.05 with key resistance just higher at 137.36/91. A topside breach / close above is needed to validate a breakout of the yearly opening-range – such a scenario would risk another accelerated move towards subsequent resistance objectives at the 50% retracement of the 2022 decline at 139.58 and the 100% extension of the yearly advance at 140.33.
Weekly-open support rests at 135.75 and is backed by the March support slope (blue), currently around ~134.30s. Ultimately, a break / close below the monthly low / 50% retracement at 133.50/71 would be needed to suggest a more significant correction is underway within the yearly range towards the 61.8% Fibonacci retracement at 132.75 and beyond.
Bottom line: The USD/JPY rally is approaching pivotal resistance into the yearly highs. From a trading standpoint, a good zone to reduce long-exposure / raise protective stops – look for possible exhaustion / price inflection into the yearly highs for guidance with the immediate advance vulnerable while below. Review my latest Japanese Yen weekly technical forecast for a longer-term look at the USD/JPY trade levels.
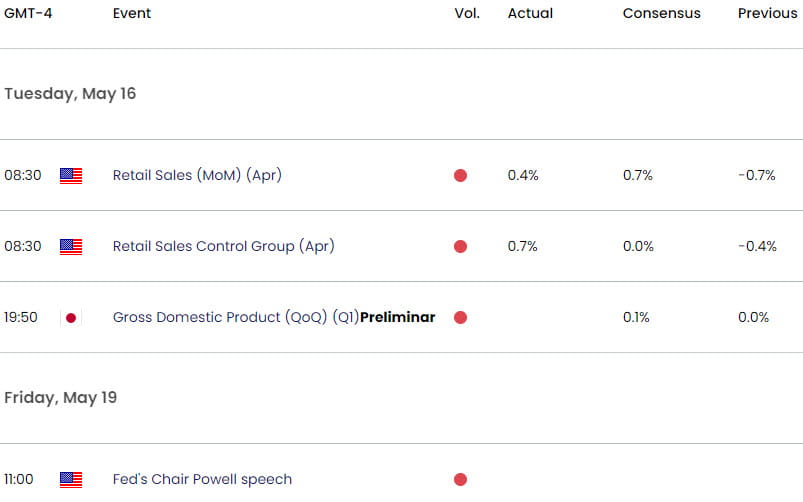
Key Economic Data Releases

Economic Calendar - latest economic developments and upcoming event risk.
Active Short-term Technical Charts
- Canadian Dollar short-term outlook: USD/CAD moment of truth at yearly support
- British Pound short-term outlook: GBP/USD breakout faces BoE
- Euro short-term outlook: EUR/USD resistance on Fed- ECB, NFP on tap
- US Dollar short-term outlook: USD battle-lines drawn ahead of Fed
- Gold short-term price outlook: XAU/USD vulnerable to larger setback
- Australian Dollar short-term outlook: AUD/USD bears emerge
--- Written by Michael Boutros, Sr Technical Strategist with FOREX.com
Follow Michael on Twitter @MBForex


