With US treasury yields starting to turn lower, just as the S&P500 hesitates at critical highs, we take a look at the bigger picture to see if sentiment could be about to turn for the worst.
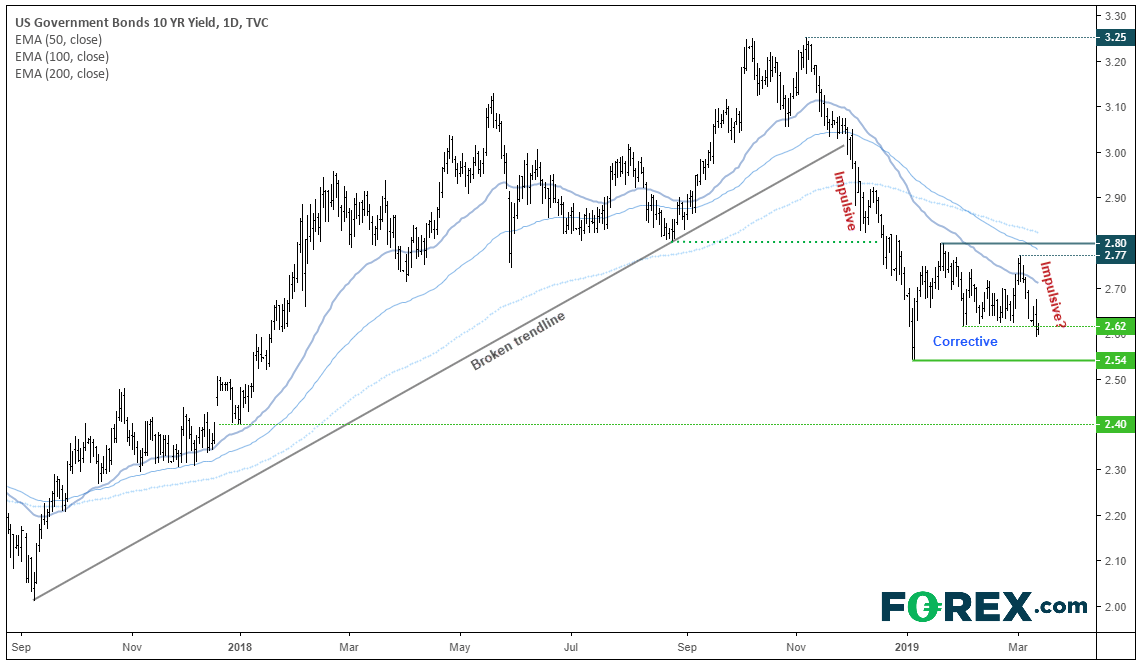
Since topping out in late November, the decline invalidated the September ’18 trendline and confirmed a primary trend reversal with a break below 2.8%. Coupled with shallow retracements and strong bearish momentum, the leg from 3.25% appears to be impulsive.
US10Y has tracked broadly sideways Since finding support at 2.54%, although a tighter range between 2.6% - 2.8% became apparent since early February. Yet trend traders could already assume a bearish breakout could be pending, as the decline into the range was bearish and price action within it appears corrective. Moreover, the range remains below the 50, 100 and 200-day eMA’s, all of which are turning lower and in ‘bearish order’.
However, if we zoom in to recent candlestick action on the daily chart, things become the more interesting.
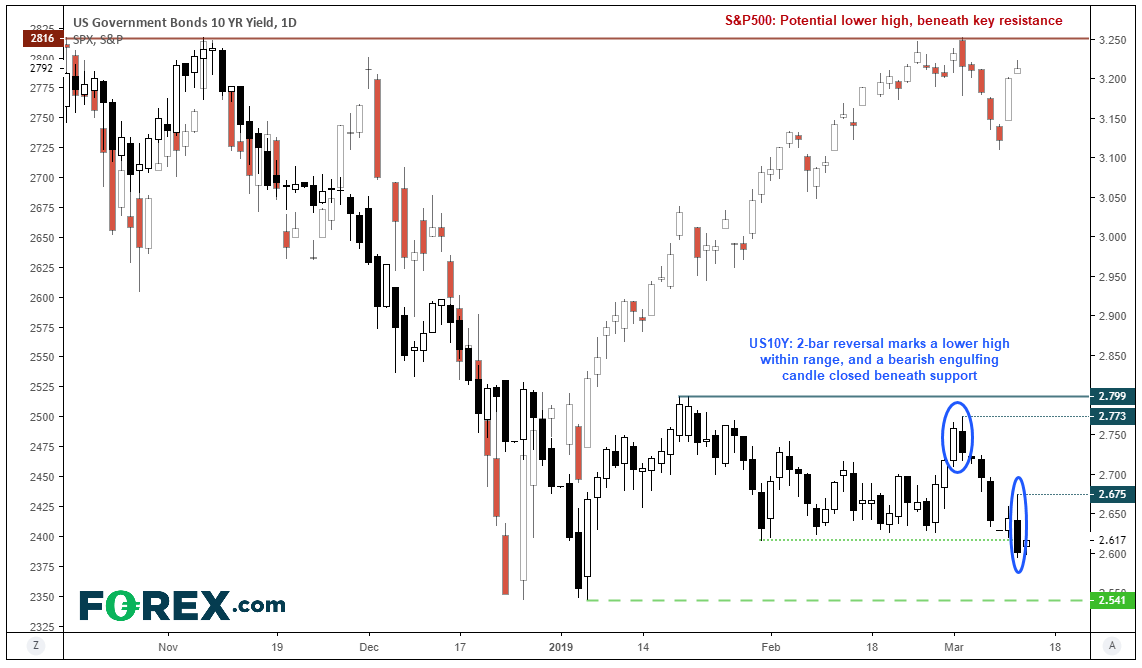
A 2-bar reversal marks a lower high within the range at 2.77%. Furthermore, a bearish engulfing candle closed beneath support yesterday to suggest bearish momentum is trying to break this lower. That this occurs as the S&P500 is struggling to re-test 2816 resistance brings into question whether we could be approaching a bout of risk-off. And perhaps the icing on the cake for bears is that, when adjusted for open interest, VIX traders are net-short at levels not seen since 2016.
So, we’ll continue to see how price action on US10Y and the S&P500 develops, because if they both break lower it assumes a broader bout of risk-off for global markets.


