Mexico releases inflation data for October on Tuesday. September’s print was 6.00%, its highest level since April. Expectations for October are 6.17% YoY while its core print is expected to be 5.17% vs 4.92% in September. September’s 5.92% reading was the highest since November 2021! Earlier this year, Banxico believed that inflation would converge to its target rate of 3% by the end of this year. Now, they are not as optimistic.
The Bank of Mexico (Banxico) has been trying to rein in inflation since it began raising rates in May, from 4% to its current rate of 4.75%. At their last meeting on September 30th, the central bank said that although they expect inflation to be transitory, “shocks may pose risks to the price formation process and to inflation expectations. The rate increase was necessary to adjust the trajectory required for inflation to its 3% target.” Thus far, the central banks efforts have not been slow the lift in inflation. Due to the increase in inflation, another 25-bps hike is expected. However, if inflation is higher than expected on Tuesday, some feel that the Bank of Mexico can raise rates as much as 50 bps!
Trade USD/MXN now: Login or open a new account!
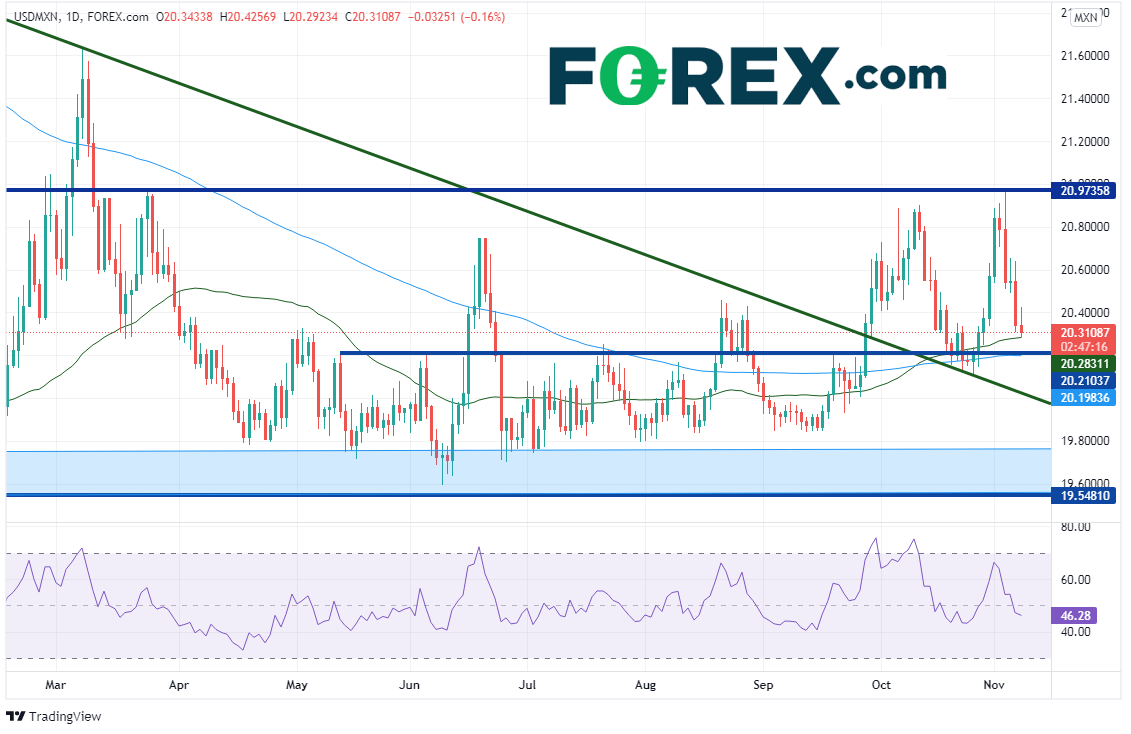
USD/MXN has been on a roller coaster ride since late September. The pair broke through horizontal resistance and a long-term downward sloping trendline, dating back to June 30th, 2020. USD/MXN continued higher and tested resistance from March 24th at 20.9697, however, it was rejected. The pair moved back to a confluence of support at previous resistance, the downward sloping trendline, and the 50- and 200-Day Moving Averages near 20.21. The support held, and USD/MXN moved higher into last week’s FOMC meeting, again testing the March 24th highs. The pair took out the resistance by a few pips, reaching a high of 20.9736. However, once the dovish taper decision was announced, the pair moved straight lower, forming an outside reversal day, and USD/MXN hasn’t looked back. It is again trading near the 50 Day Moving Average at 20.2830, just above the recent support.

Source: Tradingview, Stone X
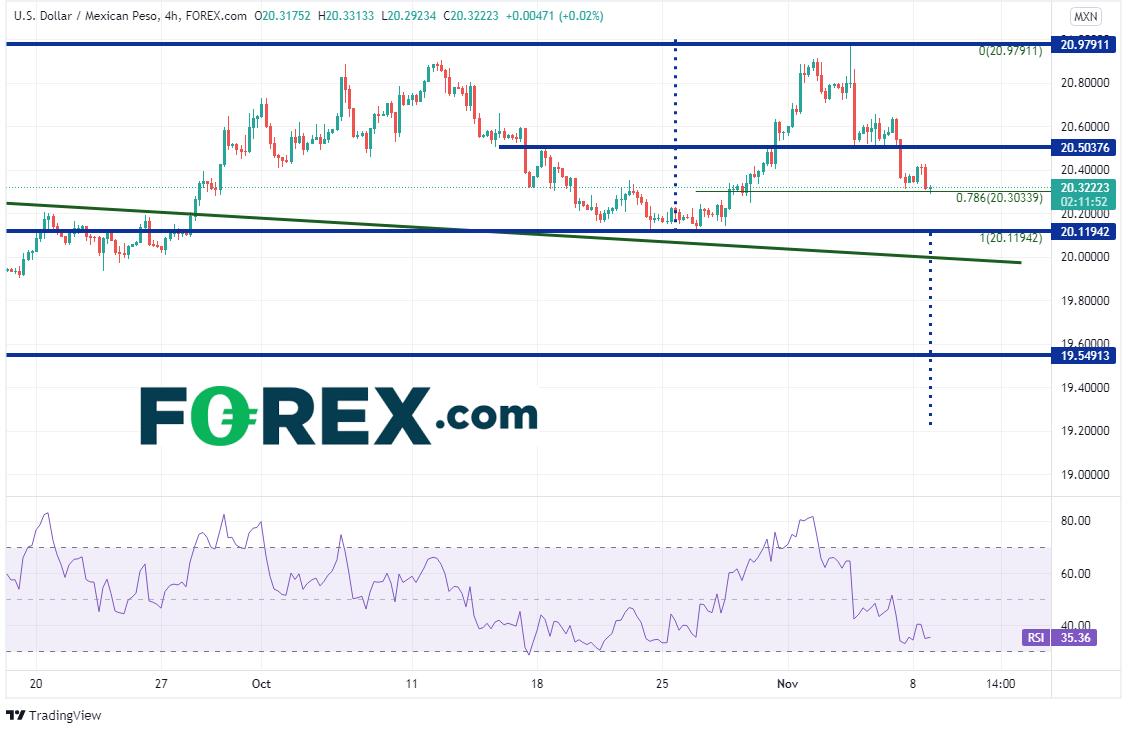
On a 240-minute timeframe, its easier to see the roller coaster of a ride USD/MXN has been on. The pair is currently trading at the (less often used) 78.6% retracement level from the lows of October 26th to the highs of November 3rd, near 20.3034. The next support level is 200 Day Moving Average at 20.1984 (see daily) , the October 26th lows at 20.1194 and the long-term downward sloping trendline near the psychological logical round number support of 20.000. There are 2 more important levels to point out below the market:
- On the daily timeframe,there has been a long-term support zone between 19.5481 and 19.8684, which has been tested many times, but price failed to break through.Watch this zone!
- If price breaks below the 20.1194, price will have formed a double top.The target for a double top is the height of the pattern added to the breakdown point, which in is near 19.23, well below the long-term support zone and the lowest level since March 2020.

Source: Tradingview, Stone X
If the USD/MXN does hold the October 11th lows, short-term resistance is above at 20.5038 and then the November 3rd highs at 20.9791.
Inflation data on Tuesday may determine whether the Bank of Mexico hikes rates by 25bps or 50bps on Thursday. If they hike 50bps, price may be in the previous support zone and on its way to the double top target. However, if they only hike 25bps, or even worse, if they don’t hike at all, watch out for a “buy the rumor, sell the fact” trade, in which case price may be back above the November 3rd highs in a hurry.
Learn more about forex trading opportunities.

