The rally is clearly not based on economic data, which continues to print a horror show. Almost 25% of the US working population has signed up for unemployment benefits, manufacturing and service sector activity remains deep in contraction, retail sales are at a record low and consumer sentiment is only very gradually lifting. The recovery in the market is well ahead of any economic recovery seen in macro data.
Instead the rally has been fuelled by extraordinary stimulus measures by the US Federal Reserve and other central banks across the globe, in addition to a $2 trillion rescue package from Congress and growing optimism of a covid-19 vaccine.
Inovio is the latest company to inform the market of progress in its vaccine development. The update comes hot on the heels of encouraging updates from Novavax, Modern and Oxford University to name a few.
The push high is also being driven by a rally in a handful of tech giants Facebook, Amazon, Microsoft, Apple and Google parent Alphabet. These tech giants make up around 20% of the weight of the S&P. These are stocks which jumped over the lockdown period as current conditions support the transition to tech.
The US lags around 2 months behind China in coronavirus crisis terms – both outbreak and recovery. China’s economy is showing a gradual recovery. The composite PMI is back above where it was at the start of the year despite halving in January, and factory profits are down -4.3% year on year, a significant improvement from the -35% decline in March, although still far from ideal.
Continuing claims
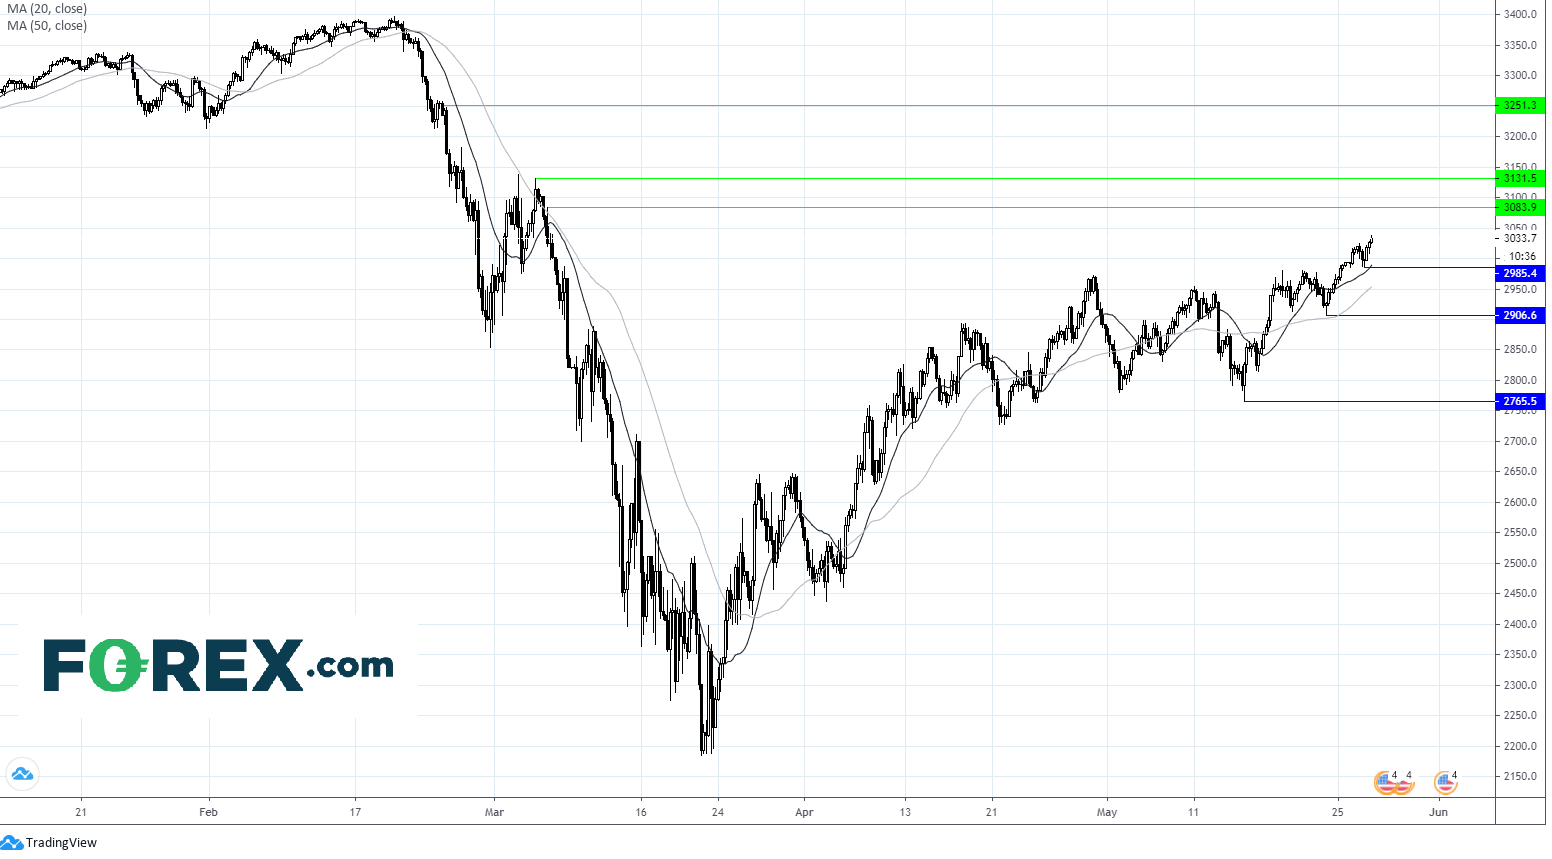
Whilst initial jobless claims have been a strong focus over the past two weeks continuing claims will now attract more attention for signs of job seekers being re-hired as states reopen their economies. Whilst the S&P has risen higher regardless of horrendous jobless claims data, surely at some point if continuing claims don't show signs of improvement the push higher will reverse or at the very least start to slow? Regardless of what we think the S&P should be doing the chart is bullish.
S&P levels to watch:
The S&P trades above its 20, 50 & 100 sma on 4 hour chart, a bullish chart.
Immediate resistance can be seen at 3082 a psychologically key level prior to the coronavirus crisis March 5th high, prior to 3130 (high 4th March).
Support can be seen at 2984 (yesterday low) 2906 (low 22nd May) and 2760 (low 14th May).


