Historically, September Has Been A Bearish Month For USD/CHF
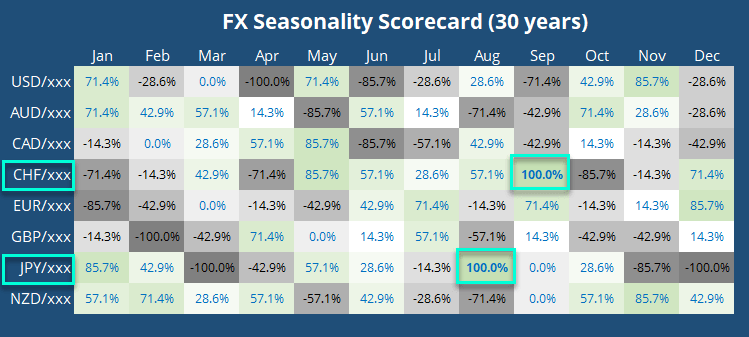
Using historical data, we’ve mapped out a seasonal matrix for FX majors and noted the bearish tendency for USD/CHF in September.
The matrix may appear a little confusing at first, although what we’re essentially looking for is a high positive (low negative) number to suggest a stronger, seasonal tendency.
Using 30 years of historical monthly data, a final score is derived from two measurements; how many peers it closed higher against for the month, over 50% of the time. For example, 100% means it closed higher for the month against all other currencies, more often than not. Whereas -100% means a currency closed lower for the month, more often than not.
Using the Japanese yen as an example, is shows that over the past 30 years, JPY has closed higher against all of its peers more often than not in August, on average. It’s also encouraging to see that JPY is currently the strongest major month-to-date, to show it followed its seasonal tendency this month.
However, as we head into the new month it’s worth noting that CHF scored 100%and USD scored -71.4% in September to suggest short USD/CHF as a potential trade idea. Taking this a step further, USD/CHF has posted a bearish return 70% of the time, over the past 30-years. That said, seasonality should be used wisely and not as a predictive tool. There are clearly many drivers in currency pair, so whilst we can use it as part of our initial research, we should let price action be our guide.
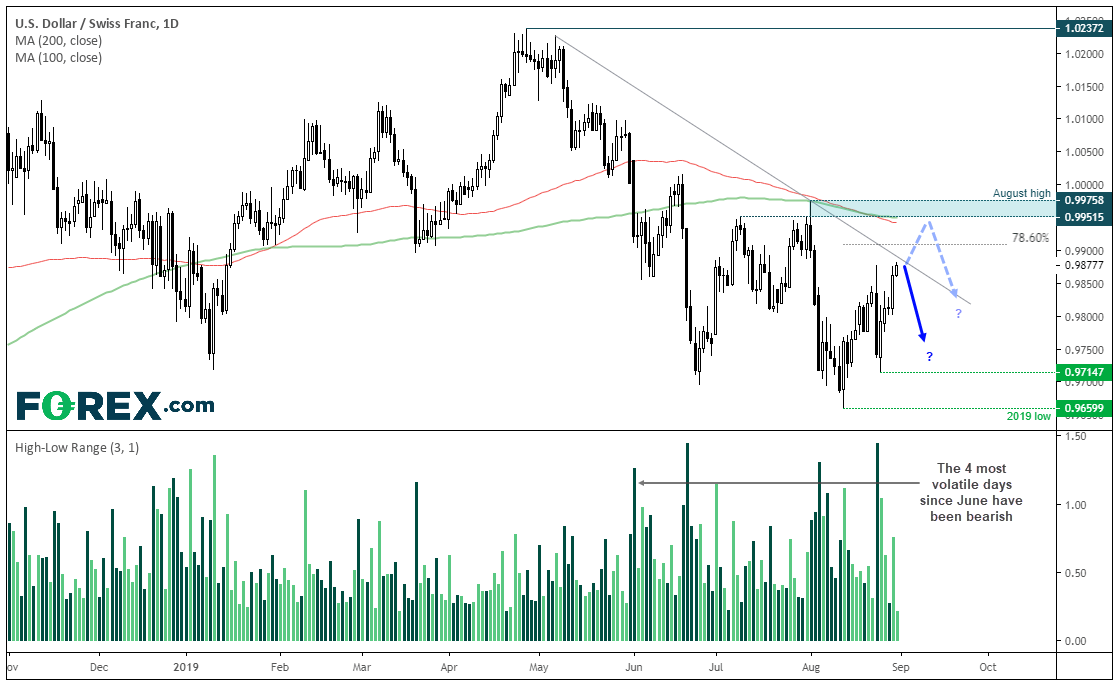
As we head towards the weekend, USD/CHF has caught a bid from safe-haven flows. However, price action remains below a bearish trendline and the 78.6% Fibonacci level. Moreover, the four most volatile days since June have been bearish, which suggests the current rally could be corrective.
- If the trendline caps as resistance, bears can look to enter short a potential swing trade short next week
- If the trendine breaks, there could be bullish opportunities between the 0.99 to the 0.9952 area, where the 100 and 200-day MA’s reside. That said, bulls may have to refer to lower timeframes to capture smaller moves.
- Take note that USD/CHF is likely to close the session with a monthly bullish hammer, and a break of the August high confirms a monthly reversal and invalids the short bias.


