- Gold and silver have surged in October despite a stronger USD and higher US rates
- Technical sell signals were generated on Wednesday with obvious reversal patterns
Overview
A stronger US dollar and higher US interest rates usually create headwinds for precious metals given they are priced in USD and offer no yield for holders, but not in 2024. Even as the greenback and US rates have ratchetted higher, gold and silver have surged, hitting record and 12-year highs respectively. If traditional negatives are no longer proving influential, what could potentially derail the rally?
Gold, silver rally despite higher rates, USD
The correlation analysis below looks at the relationship between gold and silver over the past fortnight with a number of market indicators. Gold is on the right, silver on the left.
From top to bottom, we have the shape of the Fed funds futures curve from October 2024 to December 2025 in black, providing a guide on rate cut pricing, US two-year yields in blue, US 10-year yields in green, the US dollar index in red and 10-year real bond yields in purple which measures nominal yields less expected inflation over the next decade.

Source: TradingView
For context, yields and the dollar have been on a tear over the past 10 days. Yet, despite this, gold and silver have been increasingly correlated with these variable despite being their traditional nemesis’s.
It’s not only remarkable how gold and silver have performed in this environment, but it also suggests something other than rates and FX fluctuations are driving precious metals markets.
Safe have appeal? Higher expected inflation? Ballooning fiscal deficits? Circumventing Russian sanctions? They’re the common hypotheses, although its difficult to pick which, if any, is the true driver right now. The one thing we do know is that gold and silver continue to trend higher.
Can we trust gold’s sell signal?

Source: TradingView
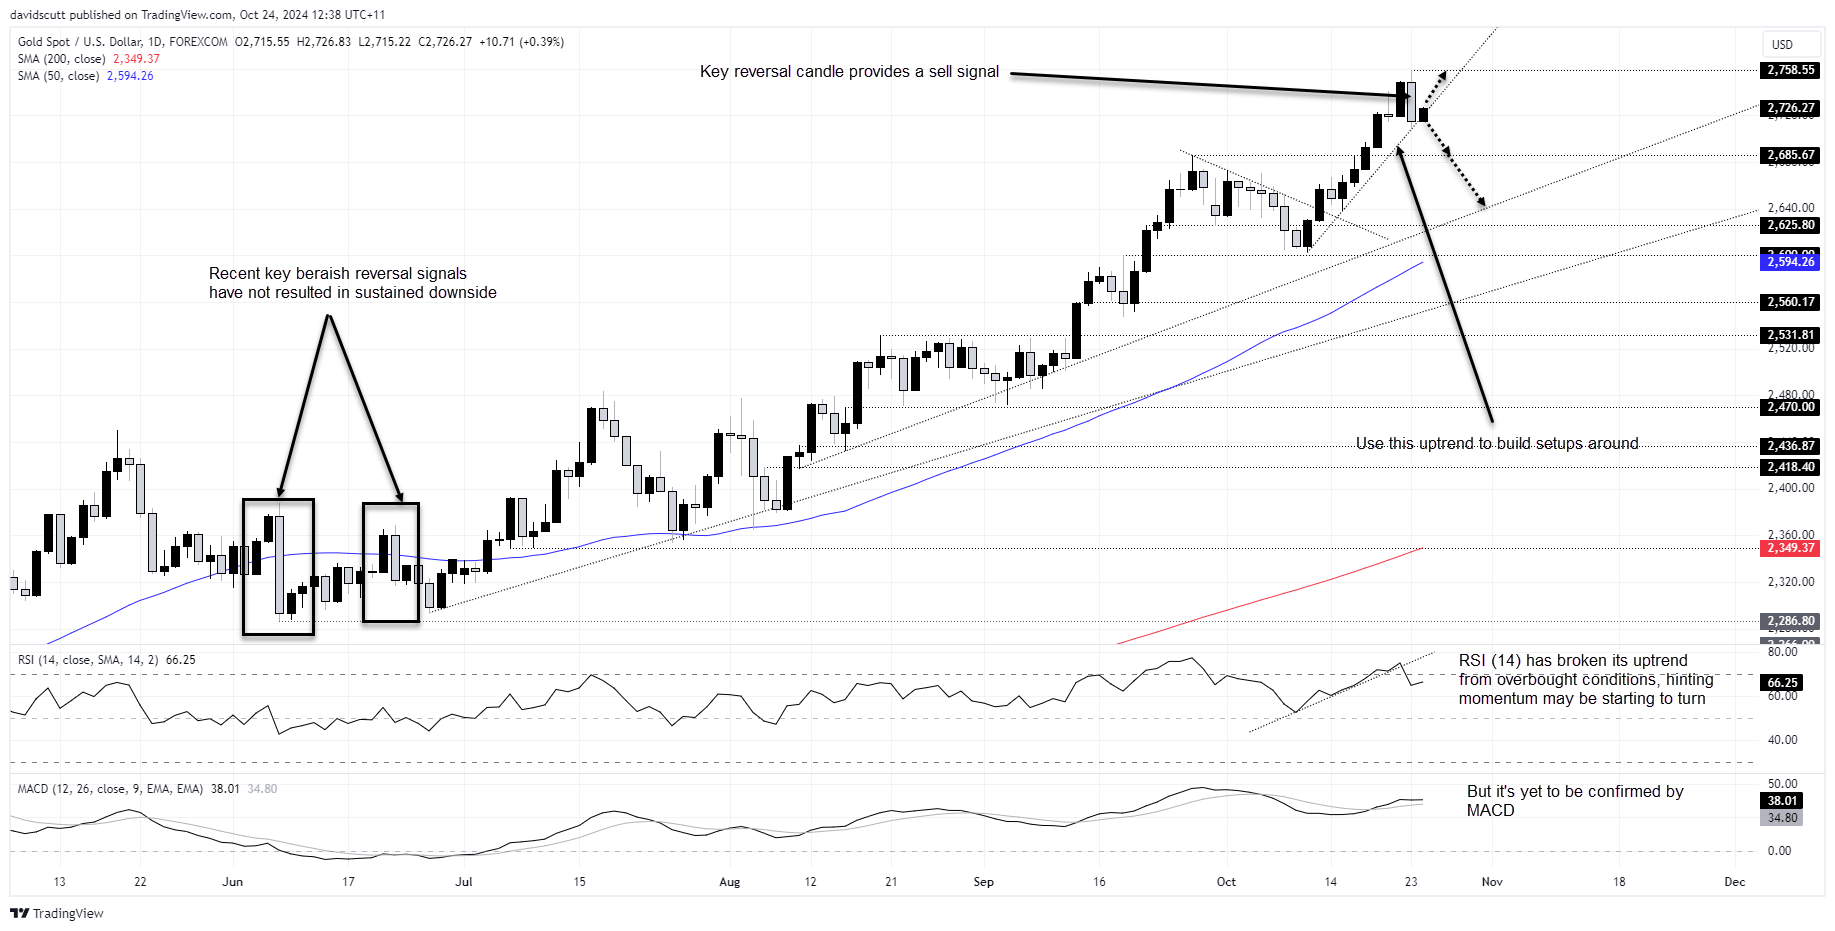
Turning to the technical picture for gold, we received an obvious sell signal on Wednesday with a key reversal candle printing on the daily timeframe. However, one look at recent history shows we have received plenty of topping signals and patterns this year, yet none tend to last long. That alone makes me wary of the bearish signal, especially with the price continuing to trend higher across numerous timeframes.
Given how strongly gold has traded recently, there may have been an element of profit-taking on Wednesday to plug losses in other asset classes, especially fixed income markets. The unwind also came from oversold levels on RSI (14), hinting short-term positioning was becoming lopsided.
Those looking at potential setups could use the uptrend running from the lows struck on October 10 to build trades around. It’s found around $2720 today. If the price manages to hold above the uptrend, you could buy ahead it with a tight stop below for protection. The obvious trade target would be the record high of $2758.55.
But if the bearish signal proves accurate – which it hasn’t yet despite RSI (14) breaking its uptrend simultaneously – you could flip the trade around, selling the downside break with a tight stop above for protection. The initial trade targe would be $2685.67, the former record high set in September.
Silver sell signals sometimes stick

Source: TradingView
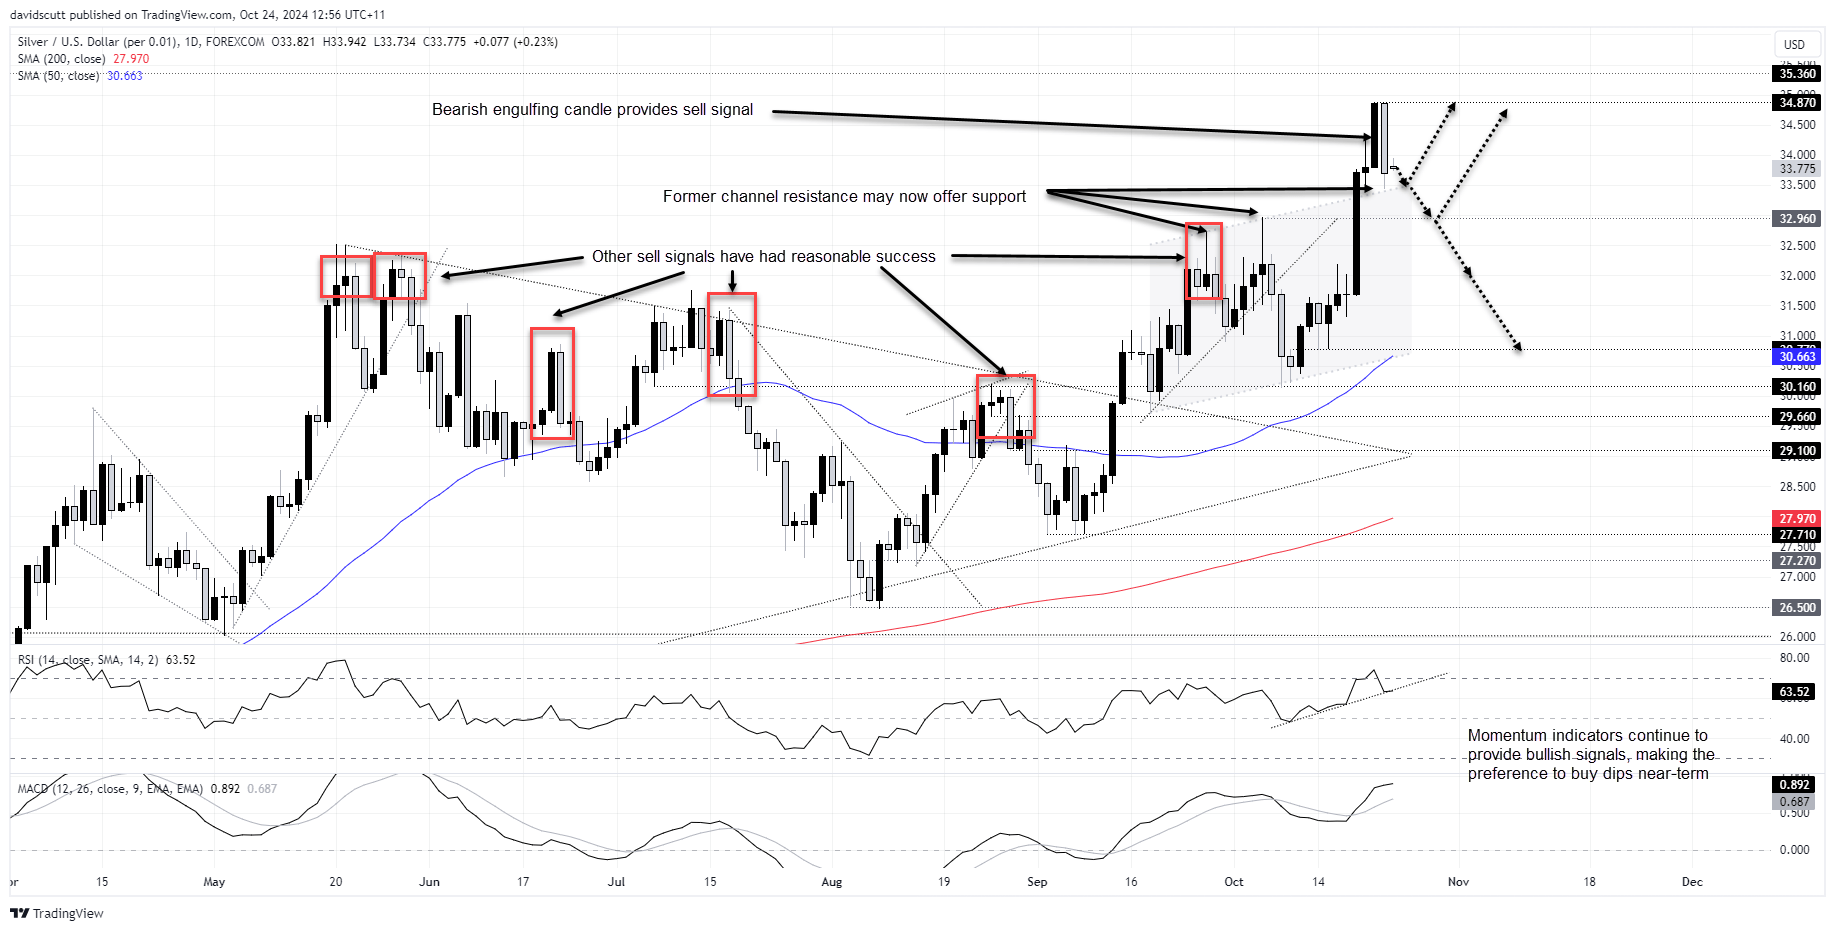
Silver also delivered a clear sell signal on Wednesday with a bearish engulfing candle, pulling back from 12-year highs set in early Asia. Unlike gold, prior reversal patterns this year have, on occasion, lasted more than a fleeting second, making this signal potentially carry more weight.
For now, the unwind stalled at former channel resistance that had capped gains prior to the bullish breakout earlier this week, hinting it may now offer support. Beneath that, $32.96 and $32 may bring out buyers.
While the price signal may carry more weight, for now, RSI (14) and MACD continue to provide bullish signals on momentum. That keeps the bias to favour buying dips.
Those considering long setups could buy either ahead of former channel resistance or $32.96 with a tight stop below for protection. Possible trade targets include $34.87 or $35.36, the latter a level not tested in over a decade.
If the price were to fall into the former ascending channel, you could look to sell with a stop above for protection. Aside from $32, $30.77 is a potential target.
-- Written by David Scutt
Follow David on Twitter @scutty


