Gold, Silver Key Points
- Gold is making another run at its 3-week high around $2385 after getting rejected from that resistance level earlier this week.
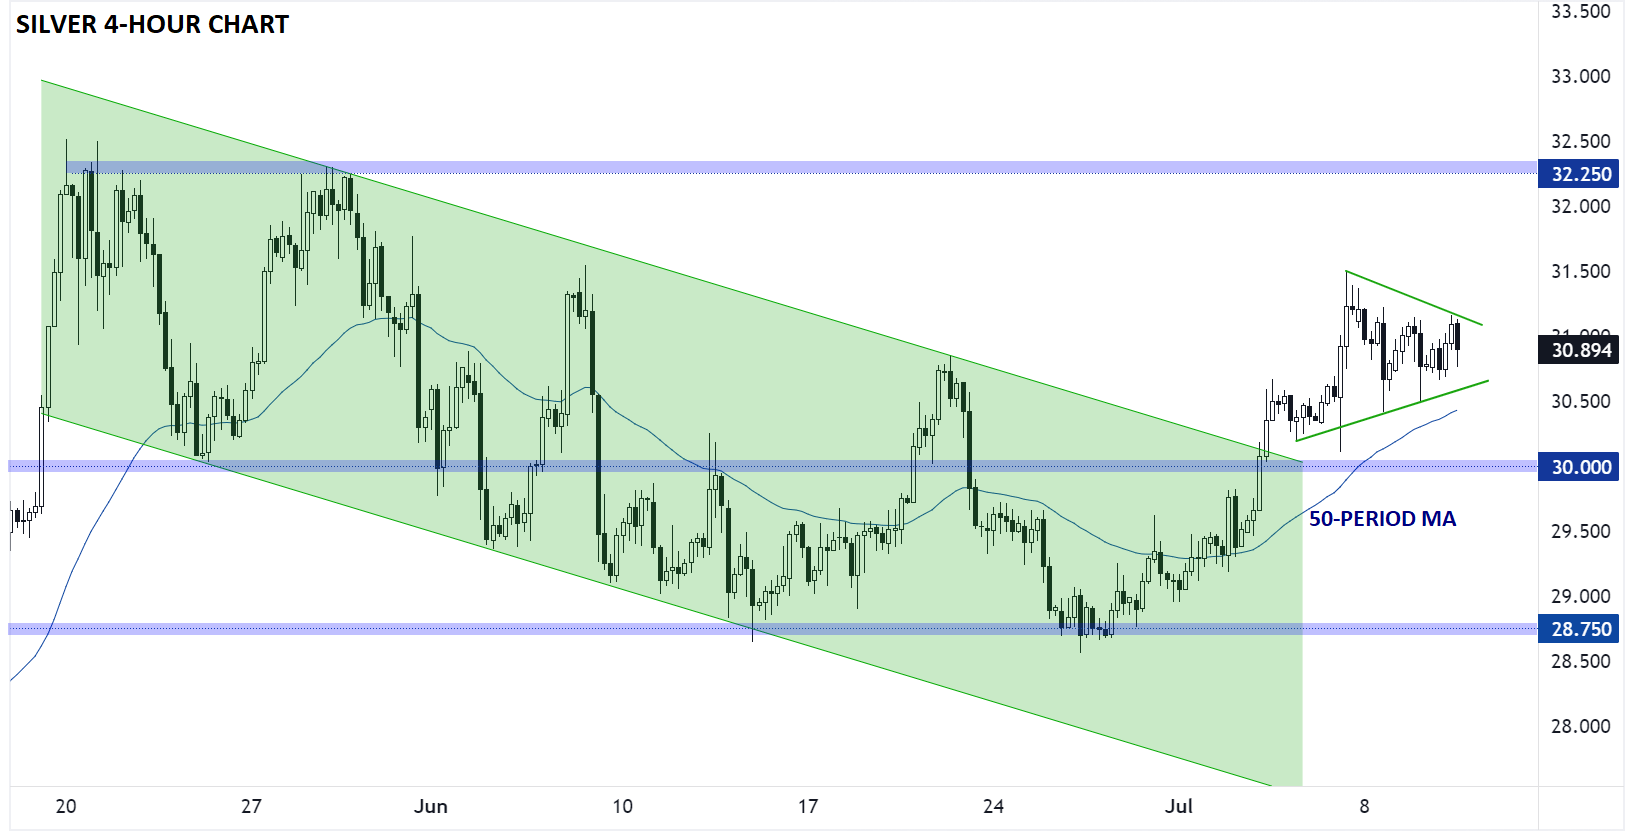
- Silver traders will be watching for a clean break above $31.50 to herald the continuation to the multi-decade highs near $32.25 next.
- This week’s marquee economic release, the US CPI report, looms large as a potential breakout catalyst tomorrow.
Today’s rather slow economic calendar has left little in the way of new catalysts for markets, and as we all know from our high school Physics classes, absent any force opposing it, an object in motion tends to stay in motion. For today’s trade, that means more marginal gains in US indices, a narrowly mixed day for the US dollar, and a continued recovery in precious metals like gold and silver.
Below, we reset the medium-term technical outlook for both gold and silver.
Gold Technical Analysis – XAU/USD 4-Hour Chart

Source: TradingView, StoneX
For its part, gold is making another run at its 3-week high around $2385 after getting rejected from that resistance level earlier this week. A breakout is far from guaranteed, but the shallow pullback to start the week suggests that bulls are eager to accumulate the yellow metal and hints at a potential bullish breakout if tomorrow’s US CPI report comes in softer than expected.
A bullish breakout would set the stage for a potential retest of the record high near $2450, while another failed breakout would keep the $2290-$2385 range intact as we head into mid-July.
Silver Technical Analysis – XAG/USD 4-Hour Chart

Source: TradingView, StoneX
Silver, meanwhile, broke its broad bearish channel last week and has gone on to rally as high as $31.50 before entering a symmetrical triangle pattern over the last few days. The shift from lower lows and lower highs to (potentially) higher lows and higher highs suggests that the medium-term trend has shifted in favor of the bulls, so traders will be watching for a clean break above $31.50 to herald the continuation to the multi-decade highs near $32.25 next. Once again, this week’s marquee economic release, the US CPI report, looms large as a potential breakout catalyst tomorrow.
-- Written by Matt Weller, Global Head of Research
Check out Matt’s Daily Market Update videos on YouTube and be sure to follow Matt on Twitter: @MWellerFX


