Gold Technical Outlook: XAU/USD Short-term Trade Levels
- Gold prices plunge more than 8.6% off yearly high- US Non-Farm Payrolls on tap
- XAU/USD risk for price inflection into key support confluence
- Resistance ~1925, 1937/43, 1965(key)– support 1903/10, 1891(critical), 1877, 1863
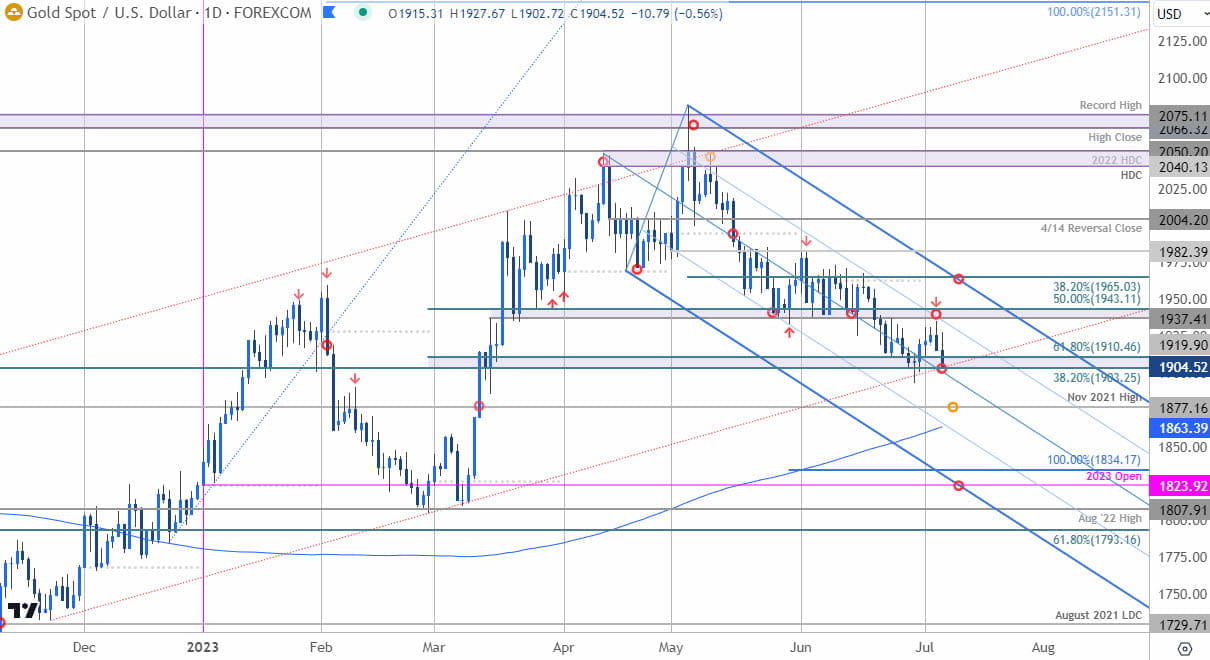
Gold prices are poised for a fourth weekly decline with XAU/USD testing critical support ahead of tomorrow’s US labor report. The battle-lines are drawn heading into NFPs as the bears challenge multi-month trend support into the July open. These are the updated targets and invalidation levels that matter on the XAU/USD short-term technical charts.
Review my latest Weekly Strategy Webinar for an in-depth breakdown of this gold technical setup and more. Join live on Monday’s at 8:30am EST.
Gold Price Chart – XAU/USD Daily

Chart Prepared by Michael Boutros, Sr. Technical Strategist; XAU/USD on TradingView
Technical Outlook: In last month’s Gold Short-term Price Outlook we highlighted that the June opening-range was set just, “above a key support pivot at 1937/43- looking for a breakout of the monthly opening-range for guidance here… Broader bullish invalidation rests with the November trendline, currently near 1890s.” A break lower one week later plunged more than 4.5% off the monthly highs with XAU/USD registering an intraday low at 1893 before rebounding into the July open. The recovery failed last week at downtrend resistance with the bears now taking another shot at key technical support. The stage is into the close of the week.
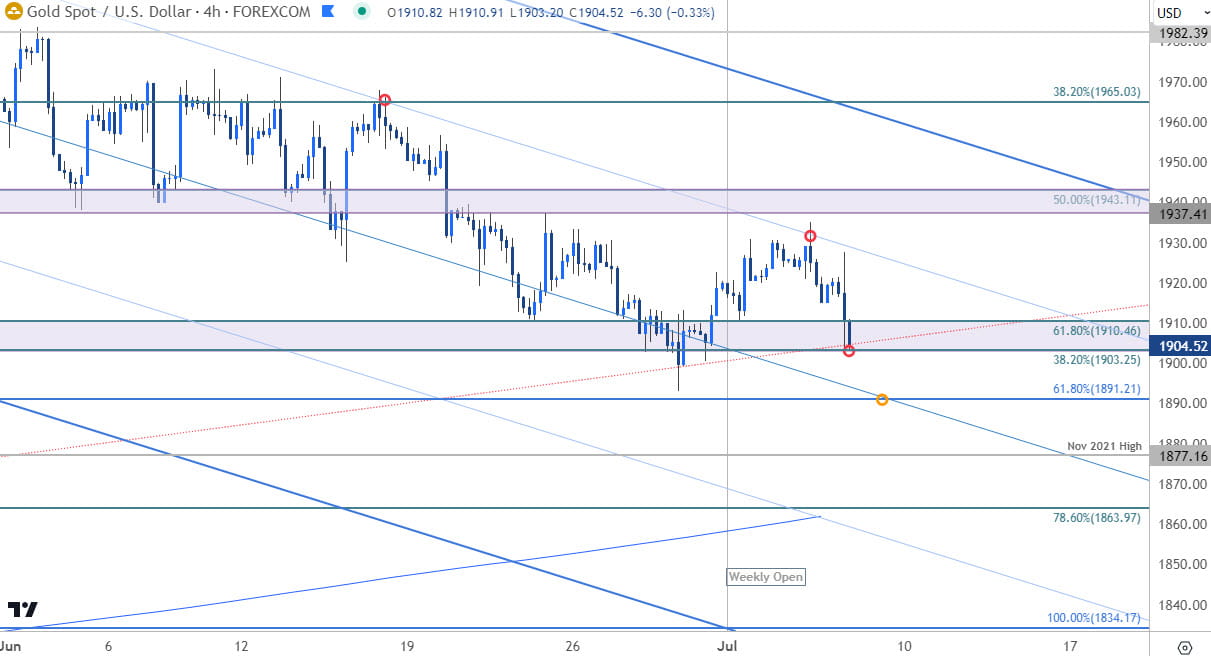
Gold Price Chart – XAU/USD 240min

Chart Prepared by Michael Boutros, Sr. Technical Strategist; XAU/USD on TradingView
Notes: A closer look at gold price action shows XAU/USD probing key support at 1903/10- a region defined by the 38.2% retracement of the 2022 advance and the 61.8% Fibonacci retracement of the objective yearly range. Note that this threshold converges on the November channel line and further highlights its technical significance.
Ultimately, a break below the 61.8% extension of the decline off the yearly highs at 1891 would be needed to mark resumption of the May downtrend. It’s important to note that such a scenario would threaten another bout off accelerated losses towards initial support objectives at 1877 (November 21’ high), the 78.6% retracement / 200-day moving average at 1863 and the 100% extension at 1834- both area of interest for possible downside exhaustion / price inflection IF reached.
Initial resistance steady at the 75% parallel (currently ~1925) backed once again by 1937/43. A topside breach / close above the upper parallel / 38.2% retracement at 1965 would be needed to invalidate the multi-month downtrend in gold.
Bottom line: Gold prices are testing confluent technical support into the monthly opening-range with major event-risk on tap tomorrow- risk for significant price inflection here. From at trading standpoint, a good zone to reduce portions of short-exposure / lower protective stops – look for a breakout of the 1903-1943 range for guidance in the days ahead with the bears vulnerable while above support. Review my latest Gold Weekly Technical Forecast for a longer-term look at the XAU/USD trade levels.
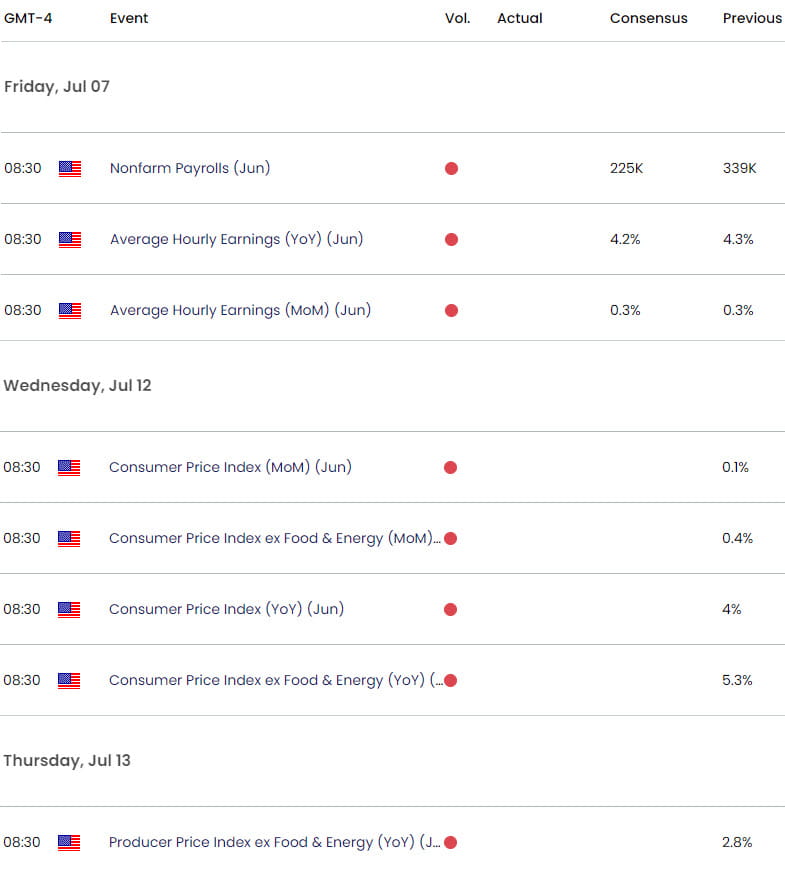
Key Economic Data Releases

Economic Calendar - latest economic developments and upcoming event risk.
Active Short-term Technical Charts
- Canadian Dollar Short-term Outlook: USD/CAD Grinds at Resistance into Q3
- US Dollar Short-term Outlook: USD Bulls Eye July Breakout
- Euro Short-term Outlook: EUR/USD Bulls Eye Uptrend Resistance Slope
- Australian Dollar Short-term Outlook: AUD/USD Plunges Back Down Under
--- Written by Michael Boutros, Sr Technical Strategist with FOREX.com
Follow Michael on Twitter @MBForex


