Gold Technical Outlook: XAU/USD Short-term Trade Levels
- Gold correction halted at lateral support pivot – FOMC on tap
- XAU/USD carves well-defined monthly opening-range- breakout imminent
- Resistance ~1969, 1982/89, 2004 (key)– support 1937/43, 1910/18 (critical), 1891
Gold prices are poised for a breakout in the days ahead as XAU/USD continues to consolidate just above technical support. The battle-lines are drawn ahead of today’s highly anticipated FOMC interest rate decision. These are the updated targets and invalidation levels that matter on the XAU/USD short-term technical charts.
Review my latest Weekly Strategy Webinar for an in-depth breakdown of this gold technical setup and more. Join live on Monday’s at 8:30am EST.
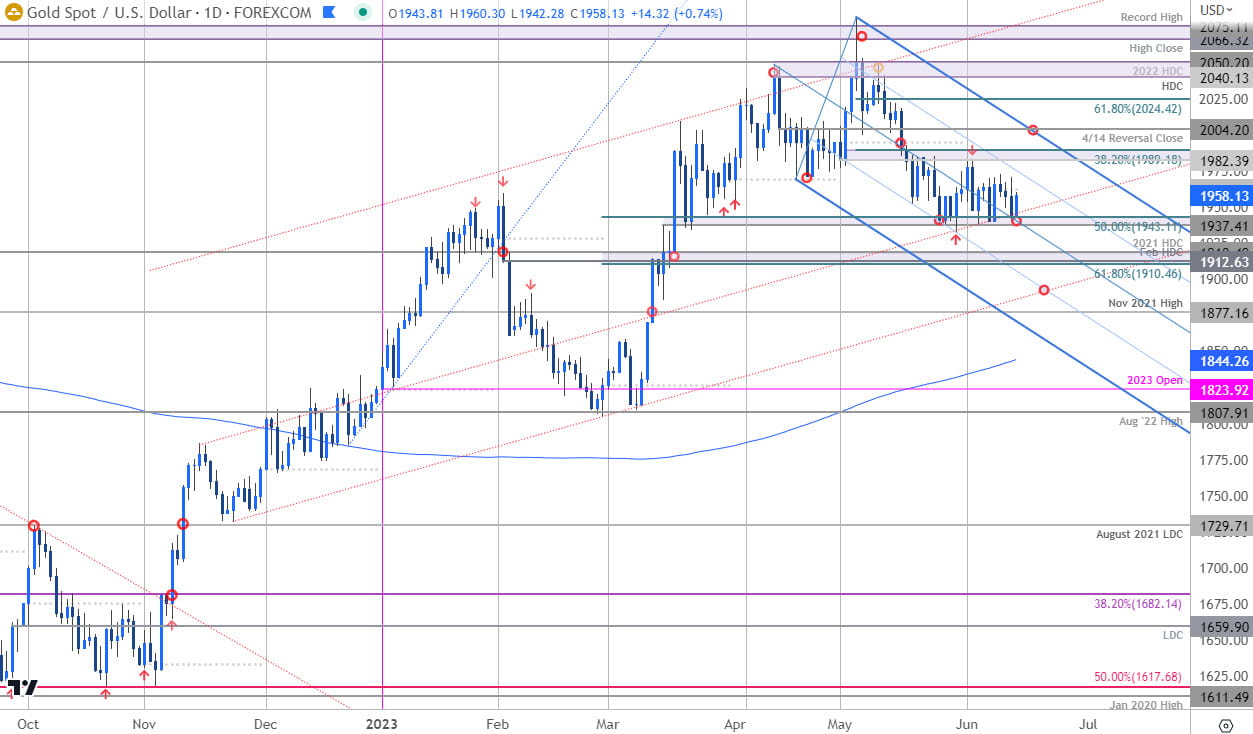
Gold Price Chart – XAU/USD Daily

Chart Prepared by Michael Boutros, Sr. Technical Strategist; XAU/USD on TradingView
Technical Outlook: In last month’s Gold short-term price outlook we noted that XAU/USD was, “in correction with a break of the objective May opening-range shifting the focus towards a late-month low.” Price registered an intra-day low at 1932 on May 30th before rebounding with the June opening range taking shape just above a key support pivot at 1937/43- looking for a breakout of the monthly opening-range for guidance here.
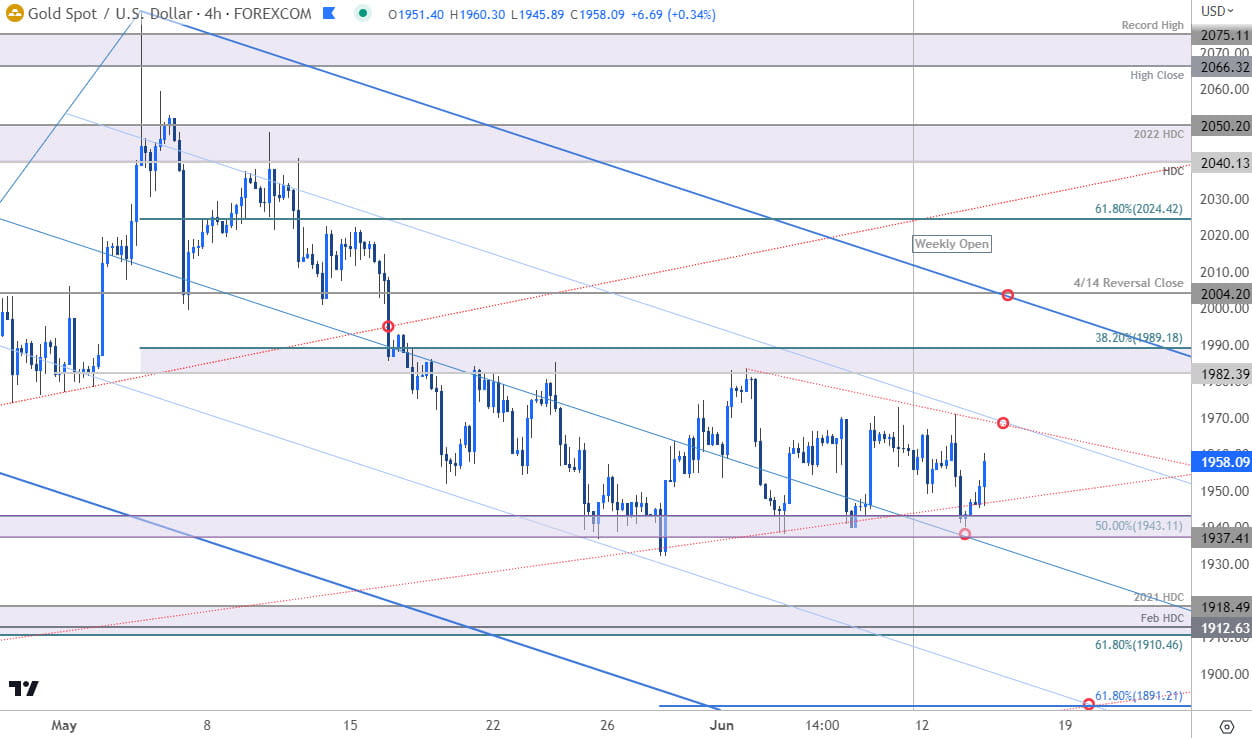
Gold Price Chart – XAU/USD 240min

Chart Prepared by Michael Boutros, Sr. Technical Strategist; XAU/USD on TradingView
Notes: A closer look at gold price action shows XAU/USD continuing to trade within the confines of a descending pitchfork formation (blue) with gold consolidating within the June opening-range, just above support. Initial resistance stands at the highlighted slope confluence near the weekly range highs around 1969- a breach above this threshold would expose a run-on subsequent resistance objectives at 1982/89 and the 4/14 reversal day close at 2004. Ultimately, a breach / close above this threshold would be needed to invalidate the May downtrend.
A break below support at 1937/43 would threaten a deeper correction towards critical support at 1910/18- a region defined by the 61.8% Fibonacci retracement of the yearly range, the February high-day close and the 2021 high-day close. An area of interest for possible downside exhaustion / price inflection IF reached. Broader bullish invalidation rests with the November trendline, currently near 1890s.
Bottom line: Gold prices have carved out a well-defined monthly opening-range just above lateral support. From at trading standpoint, looking for the breakout for guidance here with the bears vulnerable while above 1937. Review my latest Gold weekly technical forecast for a longer-term look at the XAU/USD trade levels.
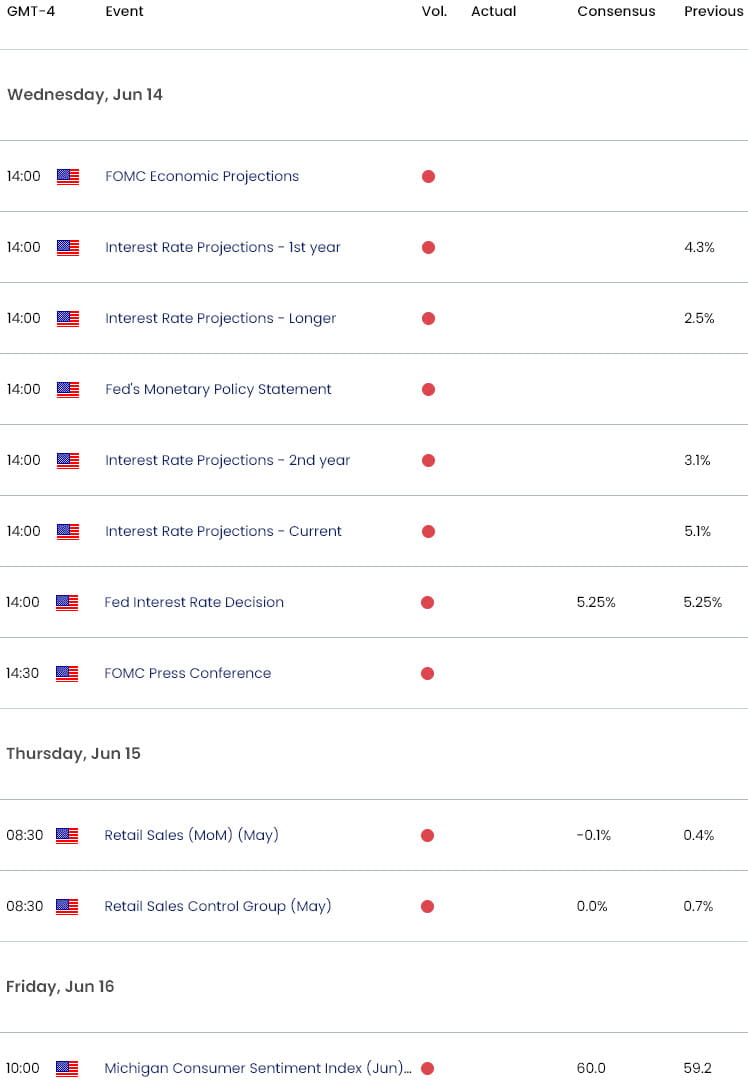
Key Economic Data Releases

Economic Calendar - latest economic developments and upcoming event risk.
Active Short-term Technical Charts
- Japanese Yen Short-Term Outlook: USD/JPY Eyes Breakout on FOMC / BoJ
- Canadian Dollar Short-term Outlook: USD/CAD Plunge Halted at Support
- British Pound Short-Term Outlook: GBP/USD Coils Above Uptrend Support
- Euro Short-term Outlook: EUR/USD Yearly-Open Support Pivot in Play
- US Dollar Short-term Outlook: USD Rips into Make-or-Break Resistance
- Australian Dollar Short-term Outlook: AUD/USD Moment of Truth at Support
--- Written by Michael Boutros, Sr Technical Strategist with FOREX.com
Follow Michael on Twitter @MBForex
note


