Gold technical forecast: XAU/USD weekly trade levels
- Gold prices reverse sharply off confluent technical resistance
- XAU/USD susceptible to pullback- constructive while within November uptrend
- Gold resistance 1988, 2035, 2075 – support 1926, 1858 (key), 1807/12
Gold prices are down on the week after rebounding off technical uptrend resistance with today’s post-FOMC rally paring a portion of the losses. While the broader outlook remains weighted to the topside, the advance may still be vulnerable here and we’re on the lookout for evidence of an exhaustion low in the weeks ahead. These are the updated targets and invalidation levels that matter on the XAU/USD weekly technical chart.
Discuss this gold setup and more in the Weekly Strategy Webinars on Monday’s at 8:30am EST.
Gold Price Chart – XAU/USD Weekly

Chart Prepared by Michael Boutros, Technical Strategist; XAU/USD on TradingView
Technical Outlook: In my last Gold Weekly Price Forecast we note that XAU/USD had responded to a critical confluence at, “the 1787-1807 support zone- a region that now includes the 50% retracement and the 52-week moving average. We’re on the lookout for major price inflection off this zone.” The lows registered that week held with gold rallying more than 11% off the lows.
The rally exhausted into confluence resistance this week at the 2022 high-week close at 1988. Initial support rests with the April high-week reversal close at 1926 with bullish invalidation now raised to the 38.2% Fibonacci retracement of the September advance at 1858.
A topside breach / close above the upper parallel (red) could fuel another accelerated rally towards subsequent resistance objectives at the record high-week close at 2034 and the record highs at 2075.
Bottom line: Gold has responded confluent resistance and we’re on the lookout for a possible exhaustion low within the confines of the uptrend. From a trading standpoint, losses should be limited to 1858 IF price is heading higher on this stretch with a close above channel resistance needed to mark resumption. I’ll punish an updated Gold short-term technical outlook once we get further clarity on the near-term XAU/USD technical trade levels.
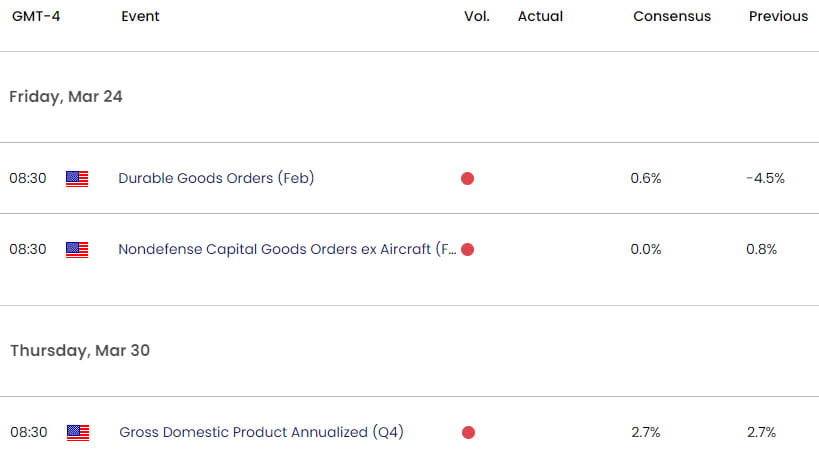
Key Economic Data Releases

Economic Calendar - latest economic developments and upcoming event risk.
Active Weekly Technical Charts
- US Dollar Index (DXY)
- Crude Oil (WTI)
- Japanese Yen (USD/JPY)
- Australian Dollar (AUD/USD)
- Euro (EUR/USD)
- Canadian Dollar (USD/CAD)
- S&P 500 (SPX500)
- British Pound (GBP/USD)
--- Written by Michael Boutros, Sr Technical Strategist with FOREX.com
Follow Michael on Twitter @MBForex


