Gold Technical Forecast: XAU/USD Weekly Trade Levels
- Gold breakout extends nearly 5.6% off October low- now testing initial resistance hurdles
- XAU/USD risk for exhaustion- technical outlook remains constructive
- Resistance 2743, 2804 (key), 3000/031– Support 2643/71 (key), 2524, 2431
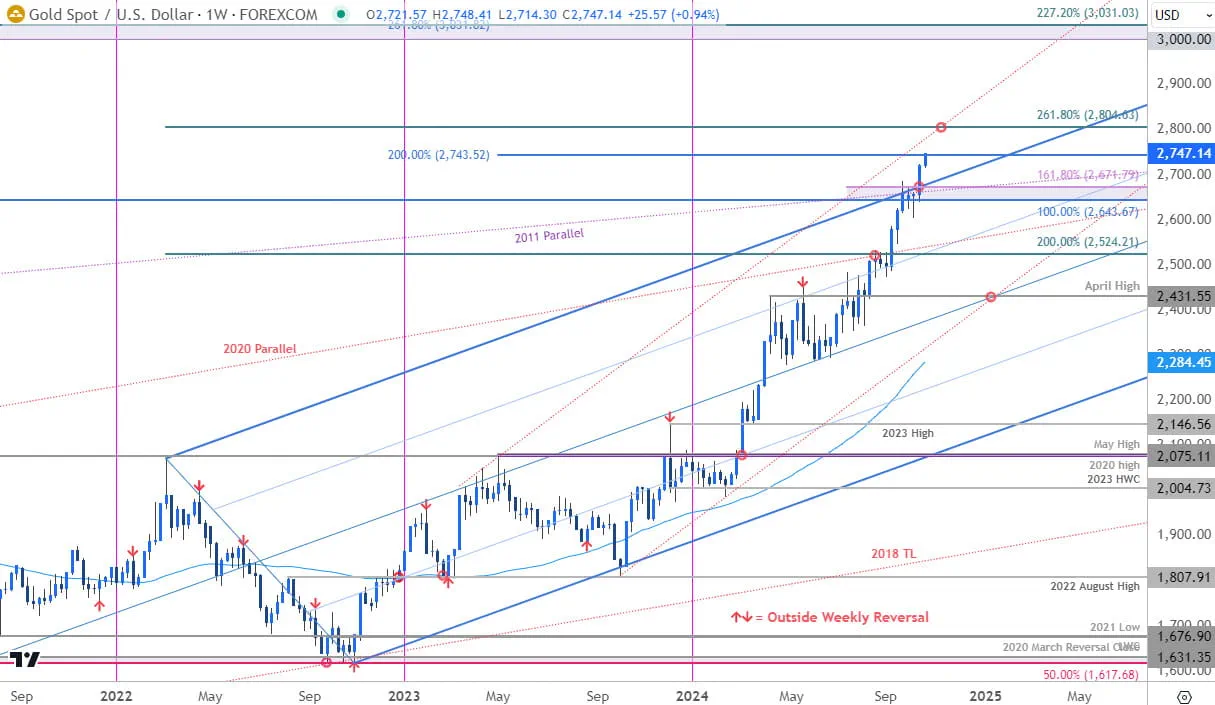
Gold prices surged through the October opening-range high last week with XAU/USD rallying more than 4.3% since the start of October. A major technical breakout has already extended into the first resistance hurdle and the focus is on this week’s close to keep the immediate advance viable. Battle lines drawn on the XAU/USD weekly technical chart into the close of the month.
Review my latest Weekly Strategy Webinar for an in-depth breakdown of this gold setup and more. Join live on Monday’s at 8:30am EST.Gold Price Chart – XAU/USD Weekly

Chart Prepared by Michael Boutros, Sr. Technical Strategist; XAU/USD on TradingView
Technical Outlook: In last month’s Gold Weekly Price Forecast we noted that XAU/USD was, “testing a critical resistance zone today / this week and the focus is on a reaction off this key threshold with the bulls vulnerable while below. From a trading standpoint, a good zone to reduce long-exposure / raise protective stops- losses should be limited to the 2517 IF gold is heading higher on this stretch with a close above 2671 needed to keep the immediate advance viable / fuel the next leg in price.” Gold held below this key zone for nearly four-weeks before breaking out last-week with the advance already stretching into initial resistance objectives at the 200% extension of the 2022 advance at 2743.
While the breakout of uptrend resistance does threaten a sustained advance here, a breach / weekly-close above this level is needed to expose the next major technical consideration at the 2.618% extension of the 2022 decline near 2804- note that a slope parallel (red) converges on this threshold over the next few weeks and we’ll be looking for a larger reaction there IF reached. Once again, a topside breach of uptrend resistance there would threaten another accelerated advance towards the next measured move at 3000/0031.
Weekly support now rests back at 2643/71- losses should be limited to this zone for last week’s breakout to remain viable. Subsequent support rests at 2524 with longer-term bullish invalidation now raised to the April high at 2431- a close below this threshold would be needed to invalidate the October 2023 uptrend.
Bottom line: The Gold breakout has cleared confluent uptrend resistance with the rally now testing initial hurdles. The immediate focus is on this week’s close. From a trading standpoint, a good zone to reduce portions of long-exposure / raise protective stops, losses should be limited to 2643 IF gold is heading higher on this stretch with a close above 2743 needed to keep the immediate advance viable.
Note that weekly momentum remains in deep overbought territory (latest RSI reading 81+) and the bulls are in control for now. Short-exposure is inadvisable as long as this condition remains- watch the weekly close here for guidance. Review my latest Gold Short-term Outlook for a closer look at the near-term XAU/USD technical trade levels.
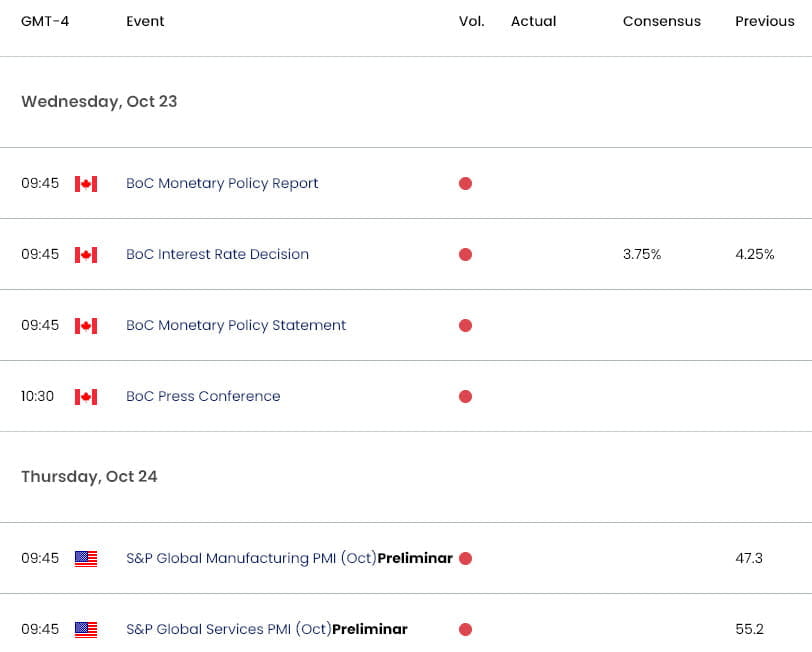
Key Economic Data Releases

Economic Calendar - latest economic developments and upcoming event risk.
Active Weekly Technical Charts
- British Pound (GBP/USD)
- Japanese Yen (USD/JPY)
- Crude Oil (WTI)
- Canadian Dollar (USD/CAD)
- Euro (EUR/USD)
- US Dollar Index (DXY)
- Australian Dollar (AUD/USD)
--- Written by Michael Boutros, Sr Technical Strategist with FOREX.com
Follow Michael on X @MBForex


