Gold Talking Points:
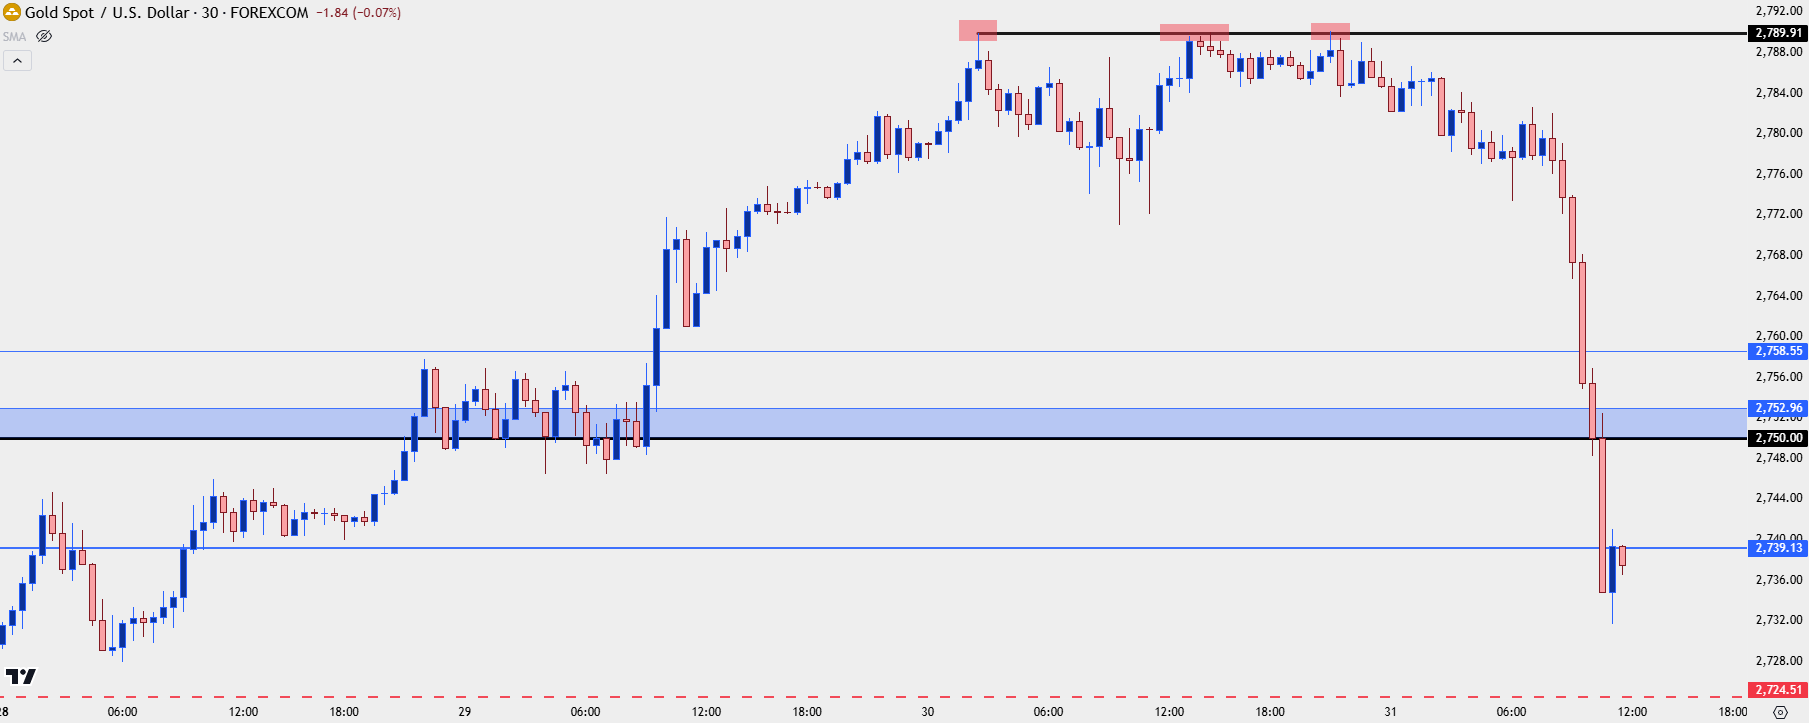
- I looked at gold stalling just inside of the 2800 level yesterday, and despite a second and third test at that same prior high after publishing that article, bulls were unable to force a test of the big figure in spot.
- Prices have pulled back quickly this morning, and this shares some resemblance to last month’s episode, when gold stalled before testing the 2700 level and then spent a few weeks brewing within a bull flag formation.
- I look at gold in-depth each week in the Tuesday webinar, and you’re welcome to join the next one. Click here for registration information.
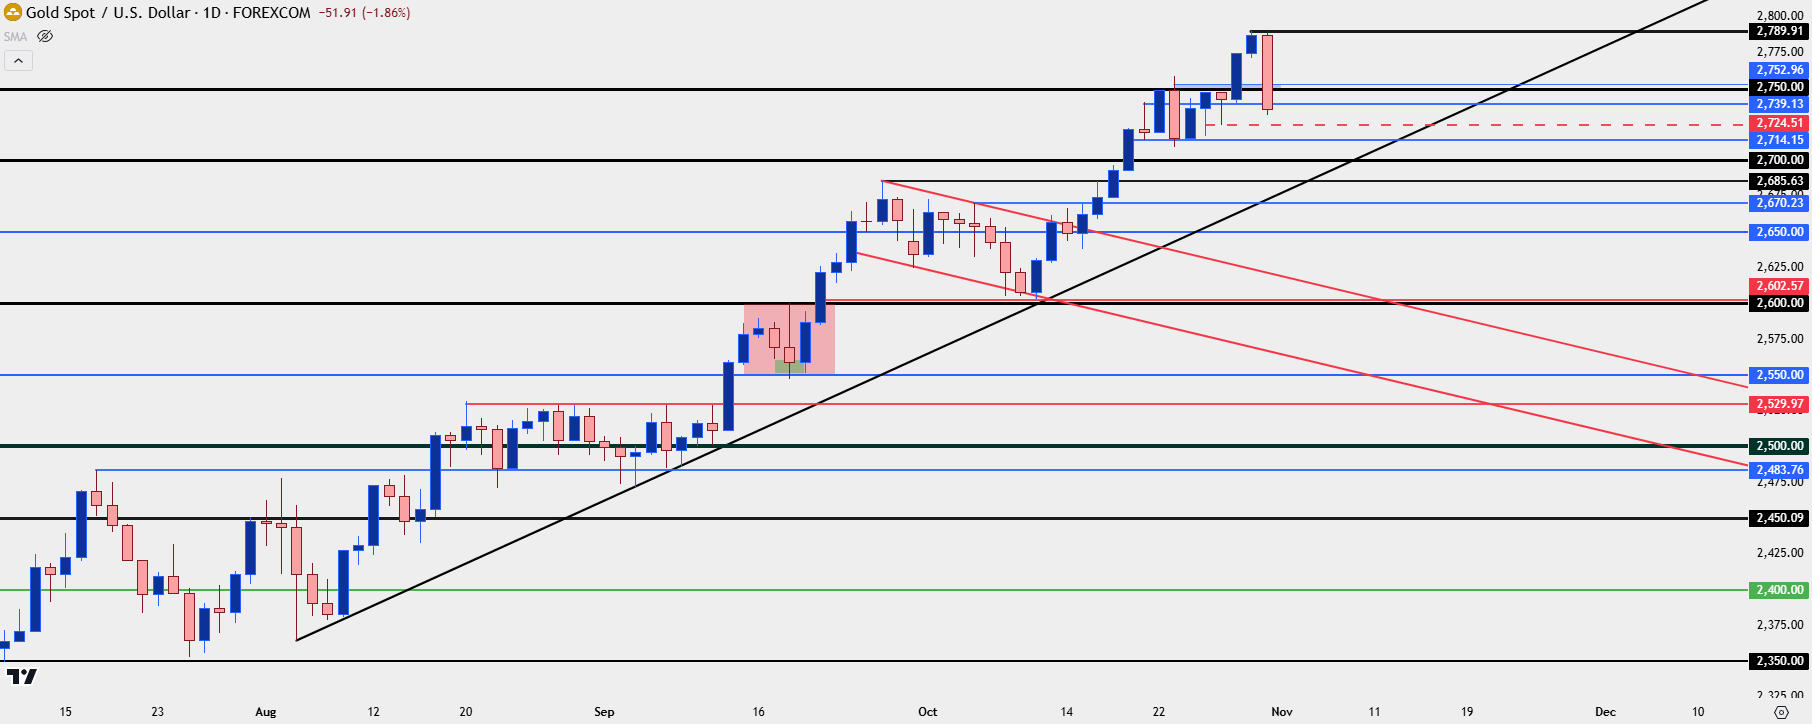
It’s been a strong year for gold prices and if we look at this from a daily or weekly chart, it appears as though there’s been only limited pullback, if any. But on shorter time frames a different picture appears and there’s been a number of pullback episodes, each of which has largely led into another bullish push and fresh higher-highs in the mix.
Just yesterday gold prices printed a fresh all-time-high. But – buyer suddenly got shy about $10 inside of the next major psychological level in spot gold, around the $2800 level. I wrote about it yesterday, highlighting the pullback potential that a scenario like that came along with.
When I published that article, there had only been one touch of resistance at 2789.91. Another developed about an hour to an hour and a half later; again, with bulls failing to push a breakout.
They didn’t relent quickly, however, as another test developed last night and this time, sellers started to take greater control of the short-term move and that’s lasted through this morning’s trade.
Spot Gold 30-Minute Chart
 Chart prepared by James Stanley; data derived from Tradingview
Gold 2700
This isn’t the first time that we’ve seen bulls pull up just shy of a major psychological level.
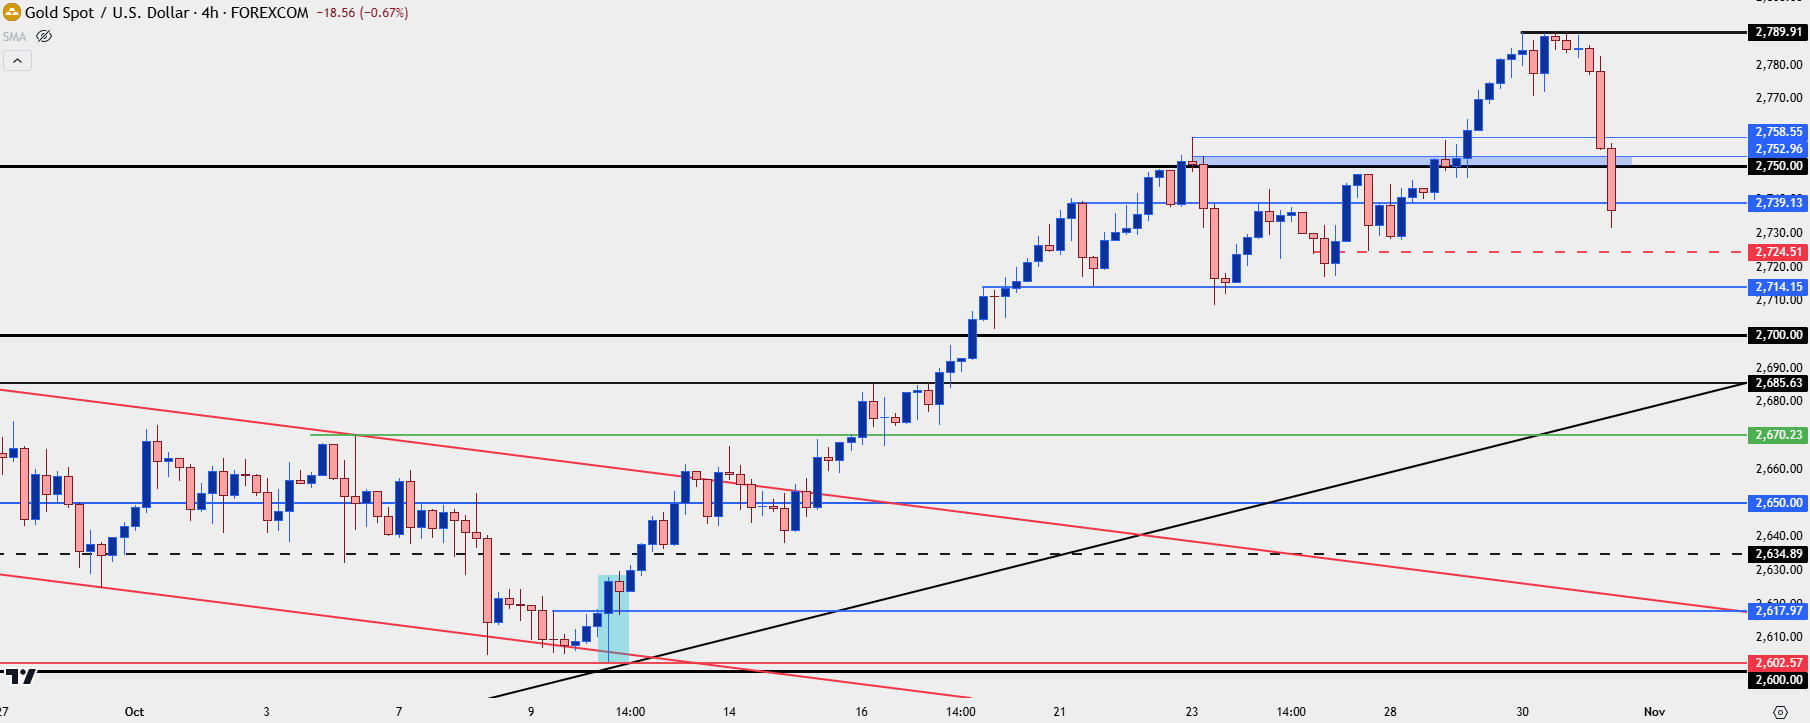
The same happened a month ago, with the post-FOMC breakout running very closely to the 2700 level before buyers pulled back about $15 shy of the big figure. That was a more touch-and-go scenario, however, as from that singular failure a bearish channel developed. When taken with the context of the prior bullish trend, that bearish channel made for a bull flag formation.
That bearish channel held for the next few weeks and that’s something that seems a clear illustration of profit taking. But perhaps ironically the low was ultimately set on the morning of US CPI three weeks ago, when a higher-than-expected CPI print built a hammer formation on the four-hour chart, and that was followed by an aggressive topside move that first re-tested 2685 before ultimately driving through the 2700 level.
After that breakout at 2700 bulls remained aggressive not even allowing for a pullback to that price, and a group of higher-lows developed around 2715 that led into the next test, at the minor psychological level of 2750.
Spot Gold Four-Hour Price Chart
 Chart prepared by James Stanley; data derived from Tradingview
Gold – Now What?
To answer the question in the headline of this article, the search now is for support. From the 30-minute chart above we can clearly see a market still in distribution mode and, at this point, I’m still of the mind that this is more driven from longs closing than shorts over-powering them. And given the totality of the run so far this year, it’s reasonable to expect a heavy long position open to taking profits after stalling ahead of a major psychological level.
But just like we saw with 2700; or as we saw with 2600 after the announcement of the FOMC rate cut or 2500 in July and August, when that major psychological level kept bulls at bay for more than a month, the question now is when or where bulls feel that value is in-play.
A natural spot of reference would be those same psychological levels that were prior resistance, so, in this case, 2700. But, like we saw with 2600, if buyers are to remain aggressive then, ideally, they wouldn’t even allow for a test of that big figure. The post-FOMC breakout saw higher-low support develop at 2602.57 and that was the same price that helped to hold the lows at the US CPI print on October 10th.
For higher-lows above the 2700 price, I’m still tracking 2724 and 2714. The 2739 level is similarly of interest if buyers can hold a daily close above that level despite an inter-day test. If the pullback can peel below those levels, however, then 2865 is of interest as this was resistance on two separate occasions and hasn’t yet been tested as support. If we get below 2685, then 2670 and 2650 are of interest and if those get taken out, we may be seeing a larger shift in the bullish trend that requires re-assessment.
Gold Daily Price Chart
 Chart prepared by James Stanley; data derived from Tradingview
--- written by James Stanley, Senior Strategist


