
May Forex Seasonality Key Points
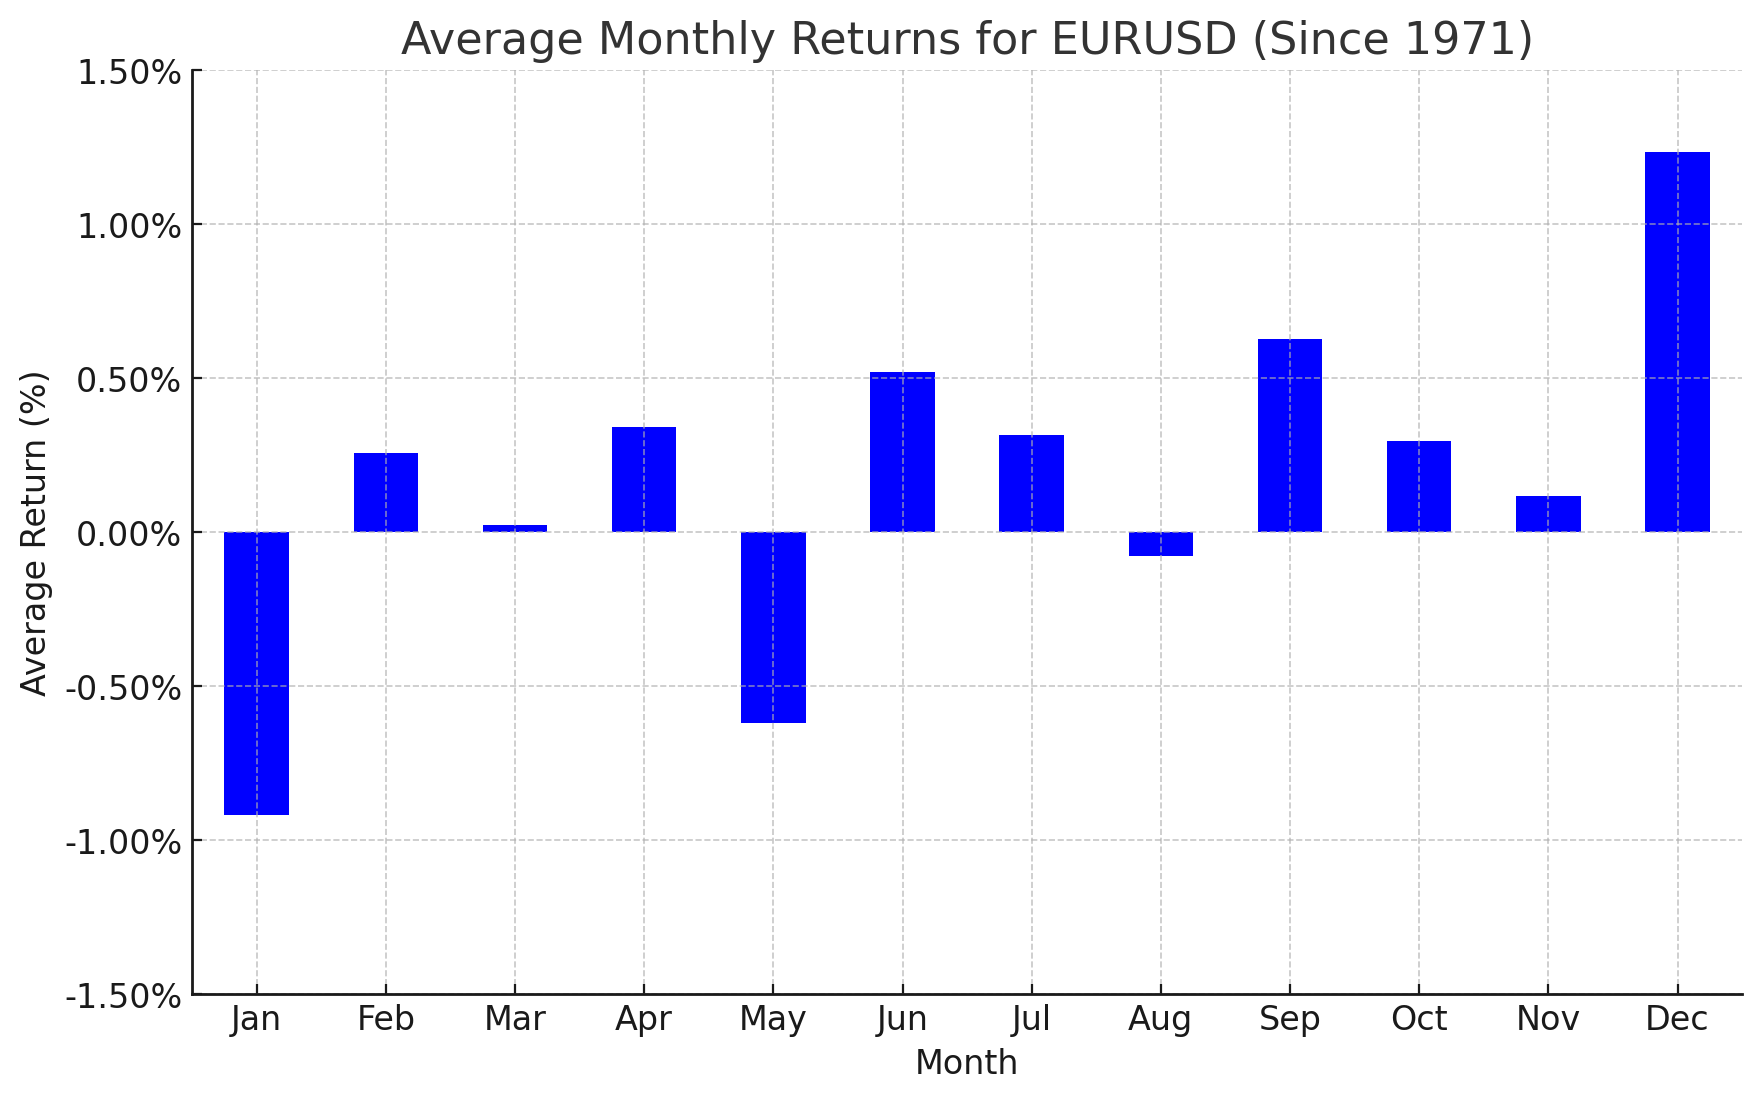
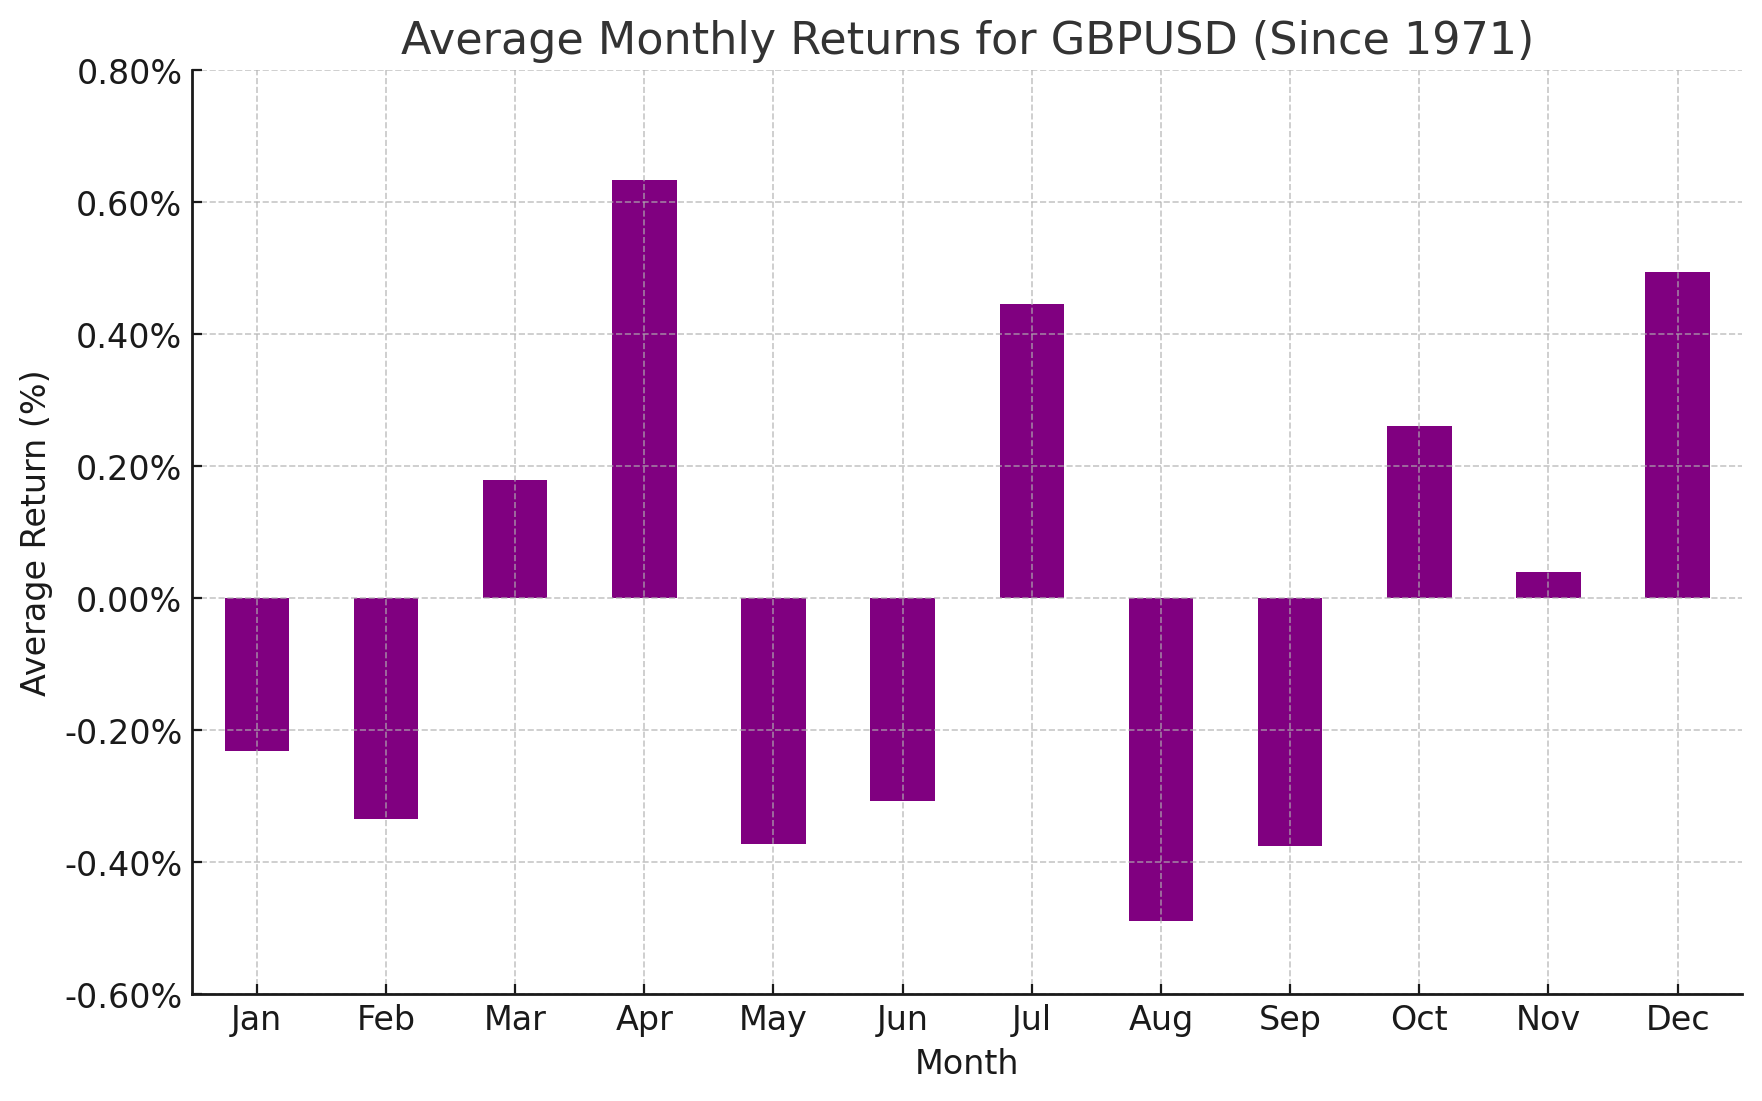
- May has historically been the second-worst month for EUR/USD (-0.62%) and GBP/USD (-0.37%).
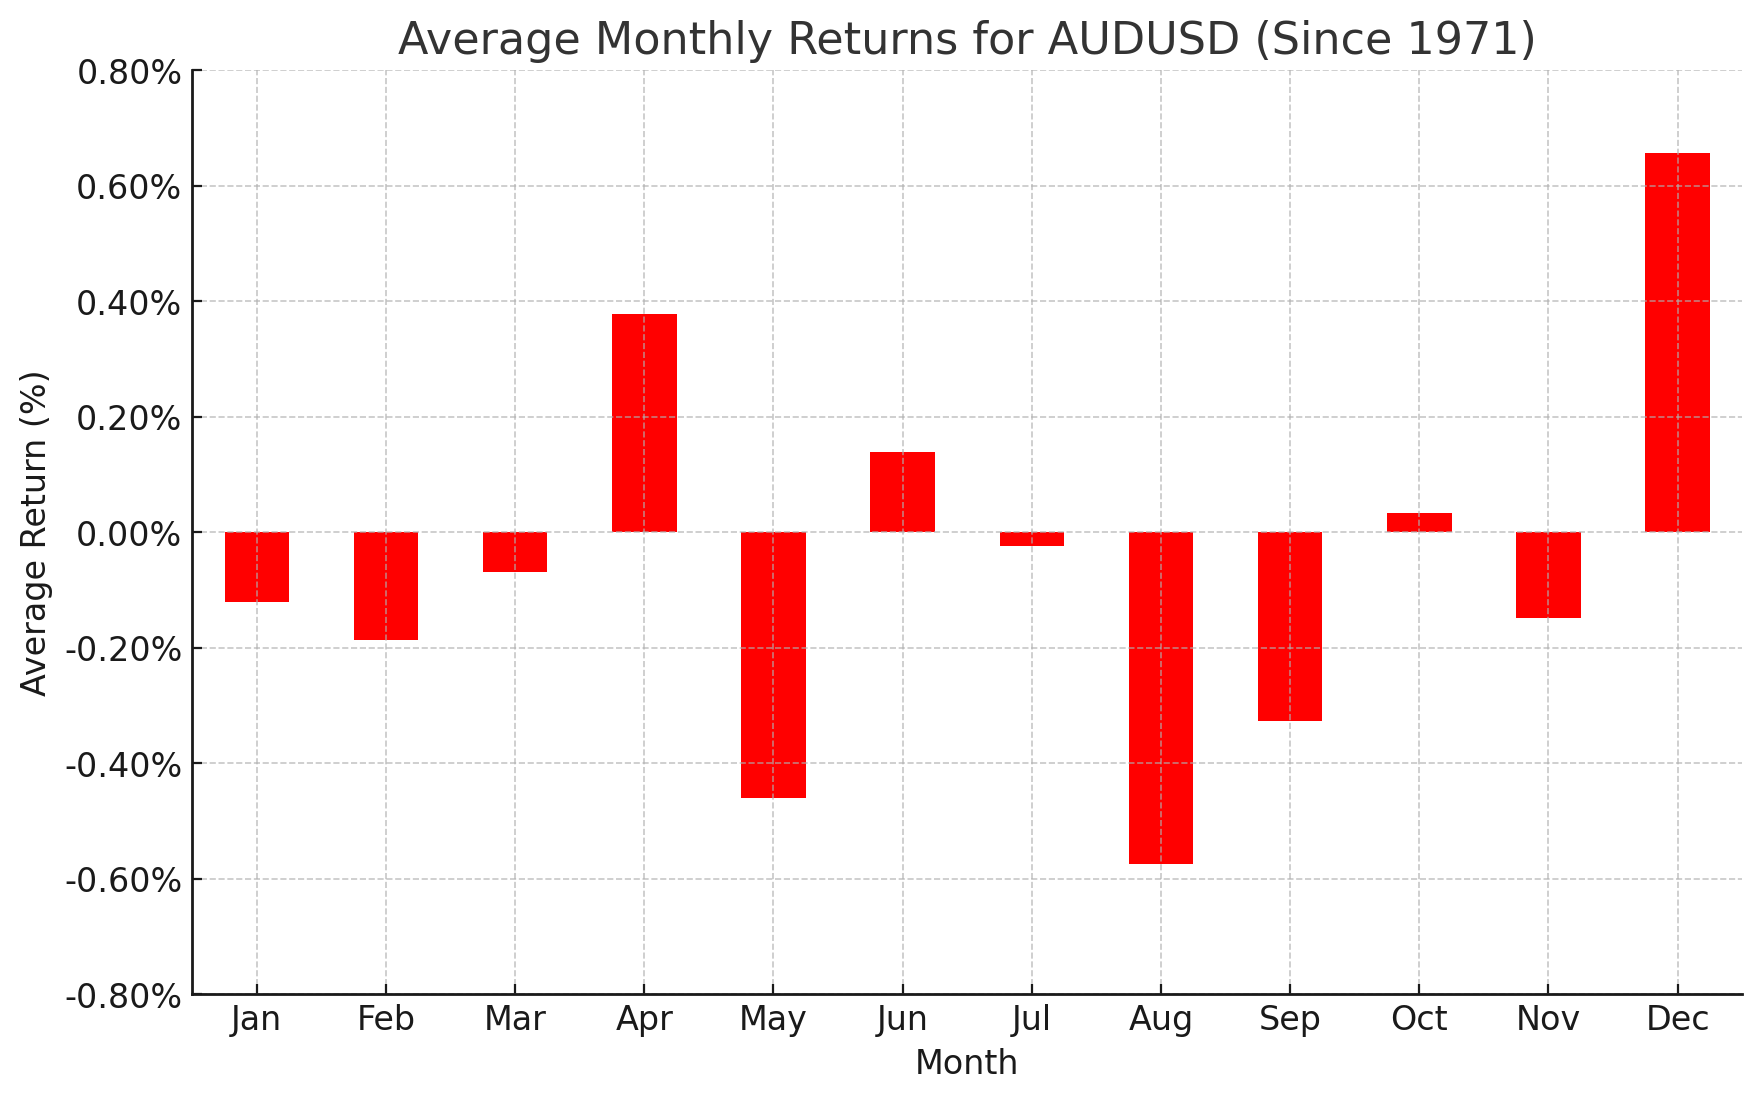
- Likewise, AUD/USD has seen relatively weak performance in the post Bretton Woods era.
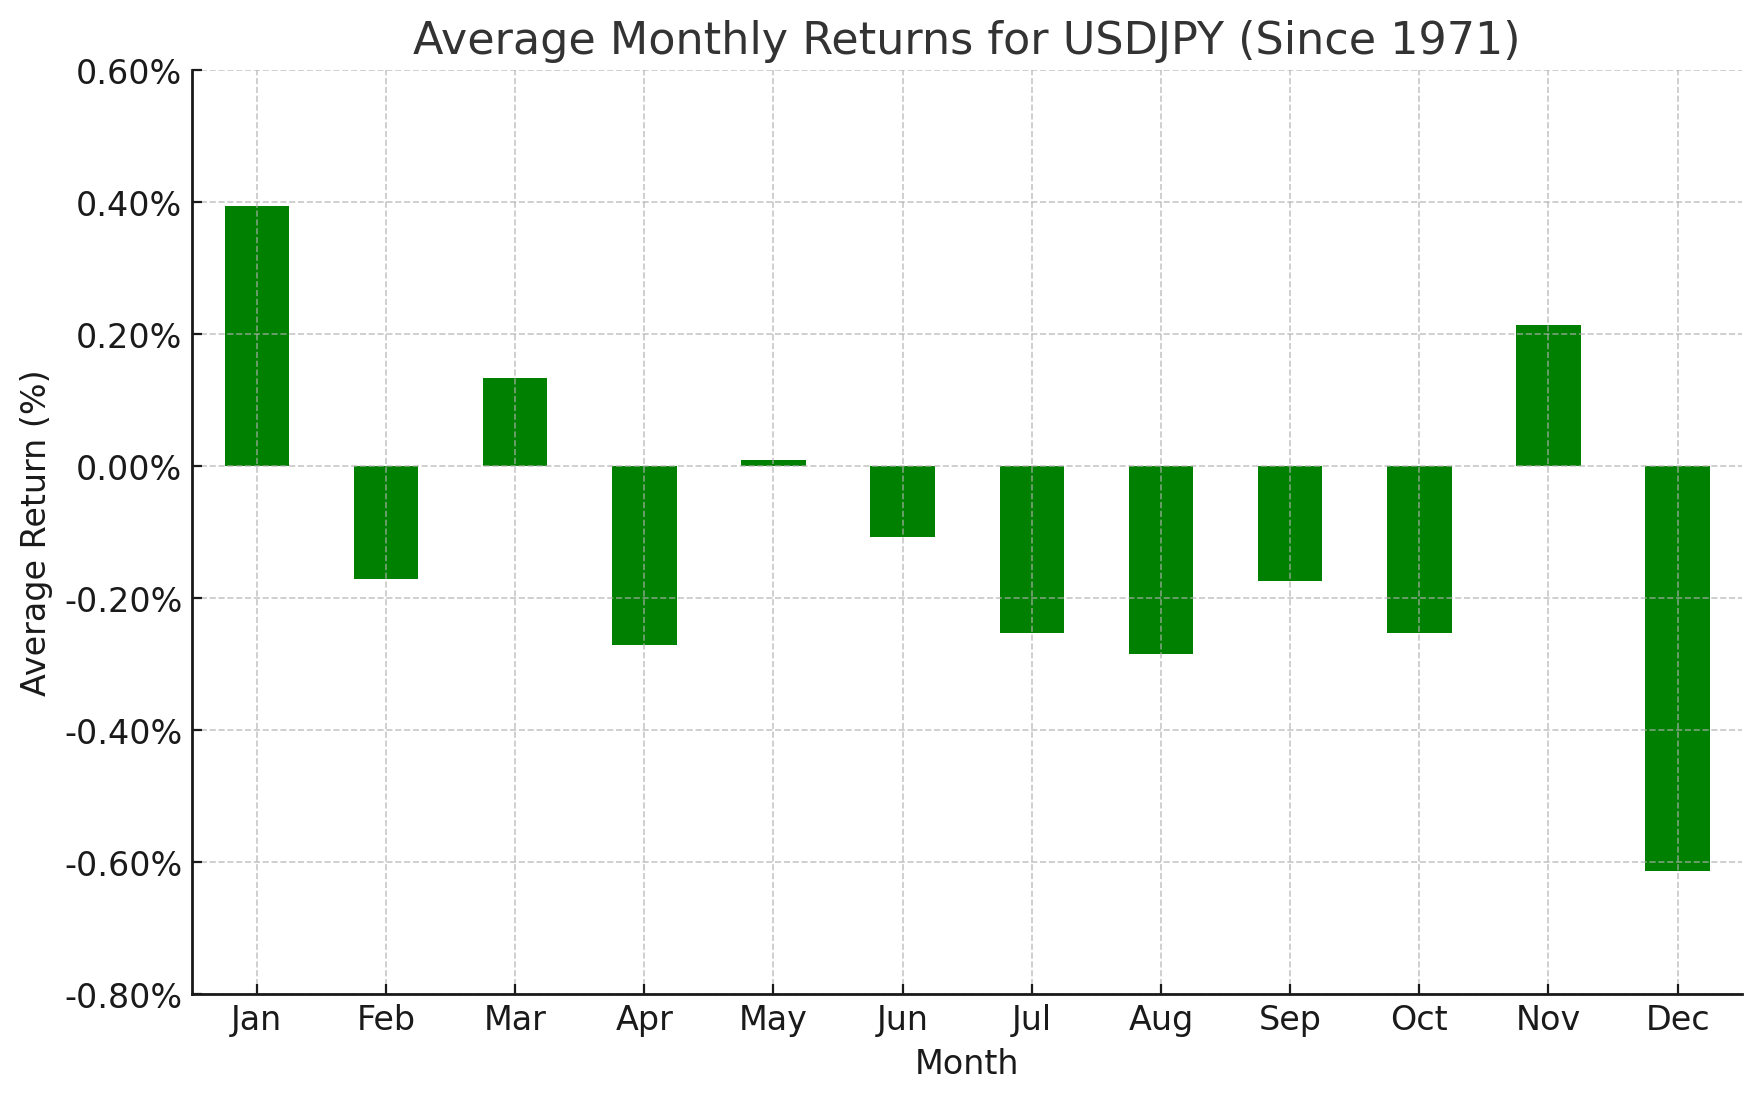
- USD/JPY (+0.01%) and USD/CAD (+0.04%) performance in May has been unremarkable
The beginning of a new month marks a good opportunity to review the seasonal patterns that have influenced the forex market over the 50+ years since the Bretton Woods system was dismantled in 1971, ushering in the modern foreign exchange market.
As always, these seasonal tendencies are just historical averages, and any individual month or year may vary from the historic average, so it’s important to complement these seasonal leans with alternative forms of analysis to create a successful long-term trading strategy.
Euro Forex Seasonality – EUR/USD Chart
Source: TradingView, StoneX
As the chart above shows, May has historically been the second-worst month for EUR/USD, with average returns of -0.62% over the last 50+ years. After mostly tracking its average historical performance through the first three months of the year, EUR/USD bucked the trend in April, falling by more than -0.8% on the month so far. If US economic data continues to come in strong over the next month, EUR/USD could be vulnerable to more downside as we move through May.
British Pound Forex Seasonality – GBP/USD Chart
Source: TradingView, StoneX
As with EUR/USD, May has generally been a relatively weak month for GBP/USD as well. Since Bretton Woods, May has been almost exactly tied with September for the second-worst GBP/USD monthly performance at -0.37%. Heading into this May, GBP/USD is testing previous-support-turned-resistance in the low-1.2500s, and if that level holds as a ceiling on price, the seasonal pattern would align with the potential for a bearish reversal.
Japanese Yen Forex Seasonality – USD/JPY Chart
Source: TradingView, StoneX
If you squint hard enough, you can just barely see that USD/JPY has historically saw a positive return in the month of May (0.01%), but obviously it’s not a particularly strong seasonal signal relative to some of the other months. With the conflict between FX traders and the Bank of Japan reaching a head at the end of April, readers may want to take the seasonality data with a bigger grain of salt than usual given the unusual fundamental backdrop.
Australian Dollar Forex Seasonality – AUD/USD Chart
Source: TradingView, StoneX
Turning our attention to AUD/USD, we can see the same general USD-based trend as with EUR/USD and GBP/USD: May has historically been the second-worst month for AUD/USD, with an average return of -0.46% since 1971. With the pair near the middle of its 1-year range between 0.6300 and 0.6900 as we go to press, bears will be hoping to push it down toward April’s 2024 lows near 0.6400 at least.
Canadian Dollar Forex Seasonality – USD/CAD Chart
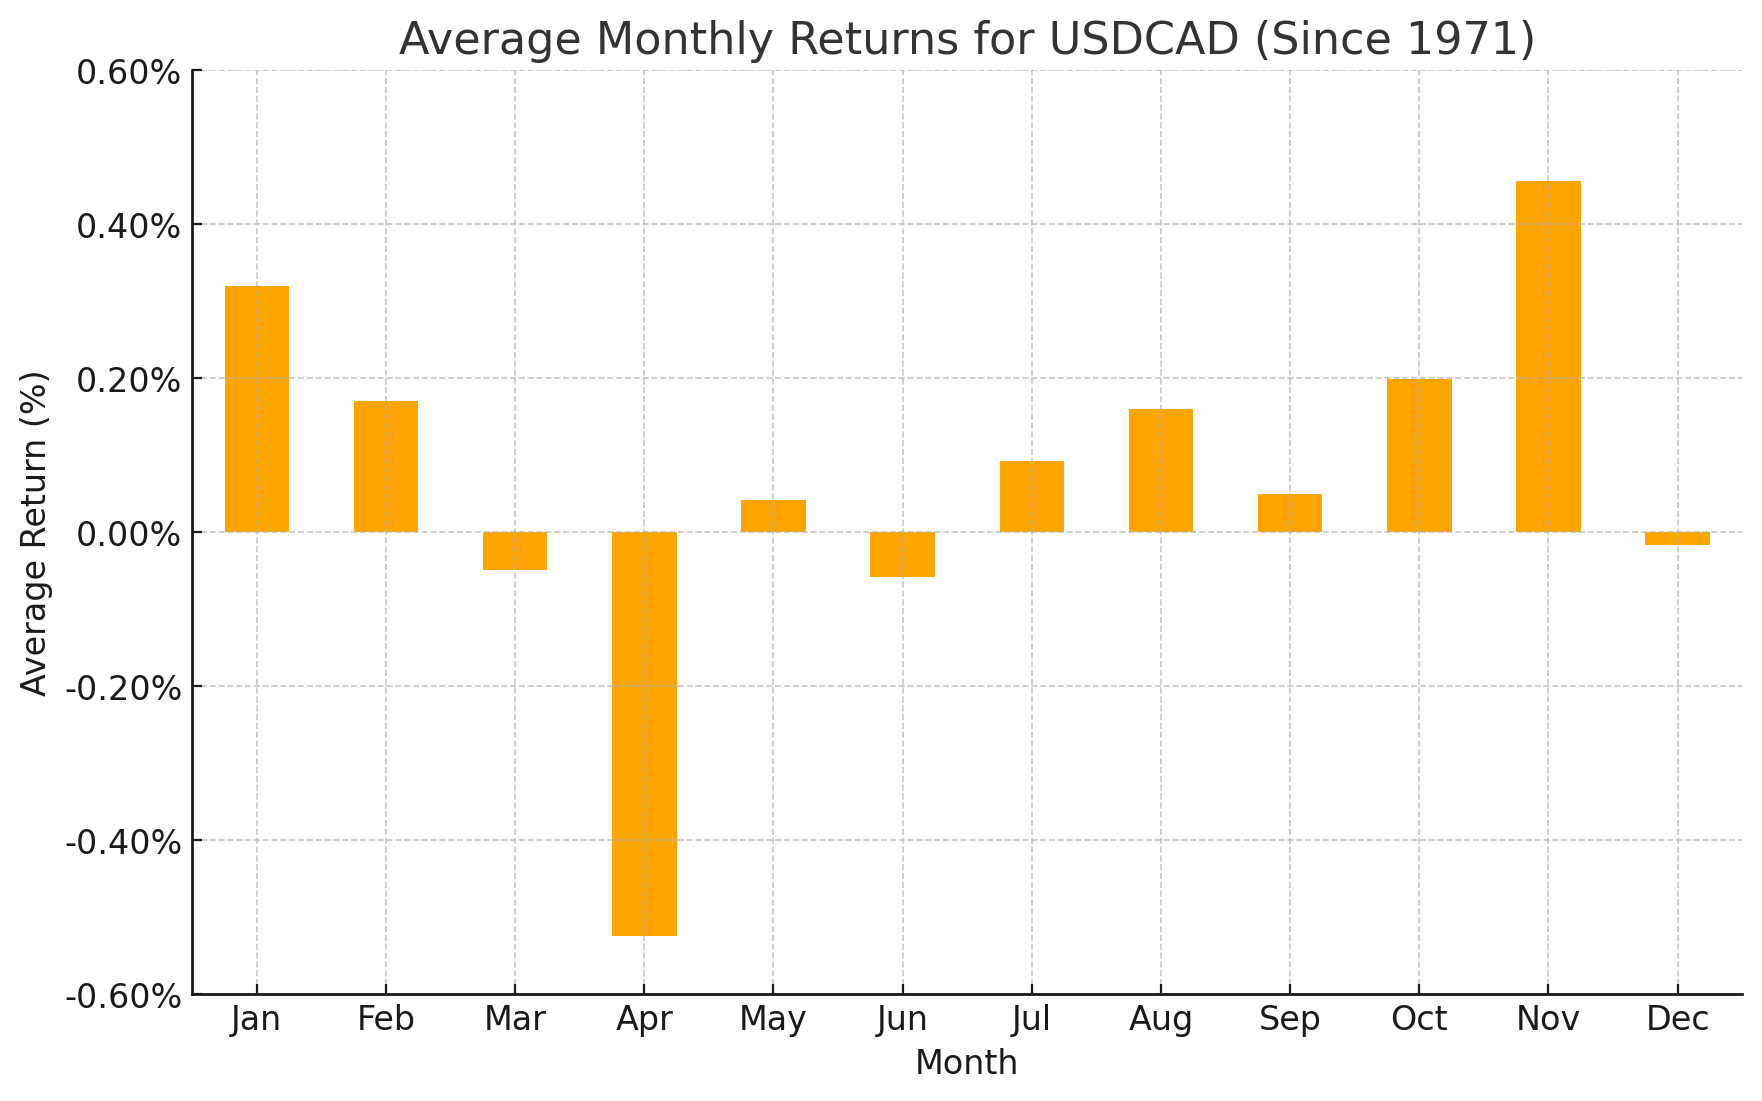
Source: TradingView, StoneX
Last but not least, USD/CAD has historically seen middling returns in May, with the North American pair grinding out an average return of just 0.04% since Bretton Woods. As of writing, USD/CAD is pulling back toward previous-resistance-turned-support at 1.3625, so it will be interesting to see if that support level puts a floor under rates over the next month.
As always, we want to close this article by reminding readers that seasonal tendencies are not gospel, so it’s important to complement this analysis with an examination of the current fundamental and technical backdrops for the major currency pairs.
-- Written by Matt Weller, Global Head of Research
Follow Matt on Twitter: @MWellerFX


