EUR/USD Talking Points:
- The European Central Bank reduced rates again this week and the door is open for more possible softening in the months ahead.
- This might not be visible from the EUR/USD chart, however, as the pair posed a stark rally in the aftermath of that rate decision.
- I’ll be looking into these setups in the Tuesday webinar and you’re welcome to join, click here for registration information.
EUR/USD put in a sizable rally from the start of Q3 and into late-August trade. This pushed the pair to deeply-overbought conditions on the daily, and price even came close to overbought territory via RSI on the weekly chart, with a 69.8 read three weeks ago.
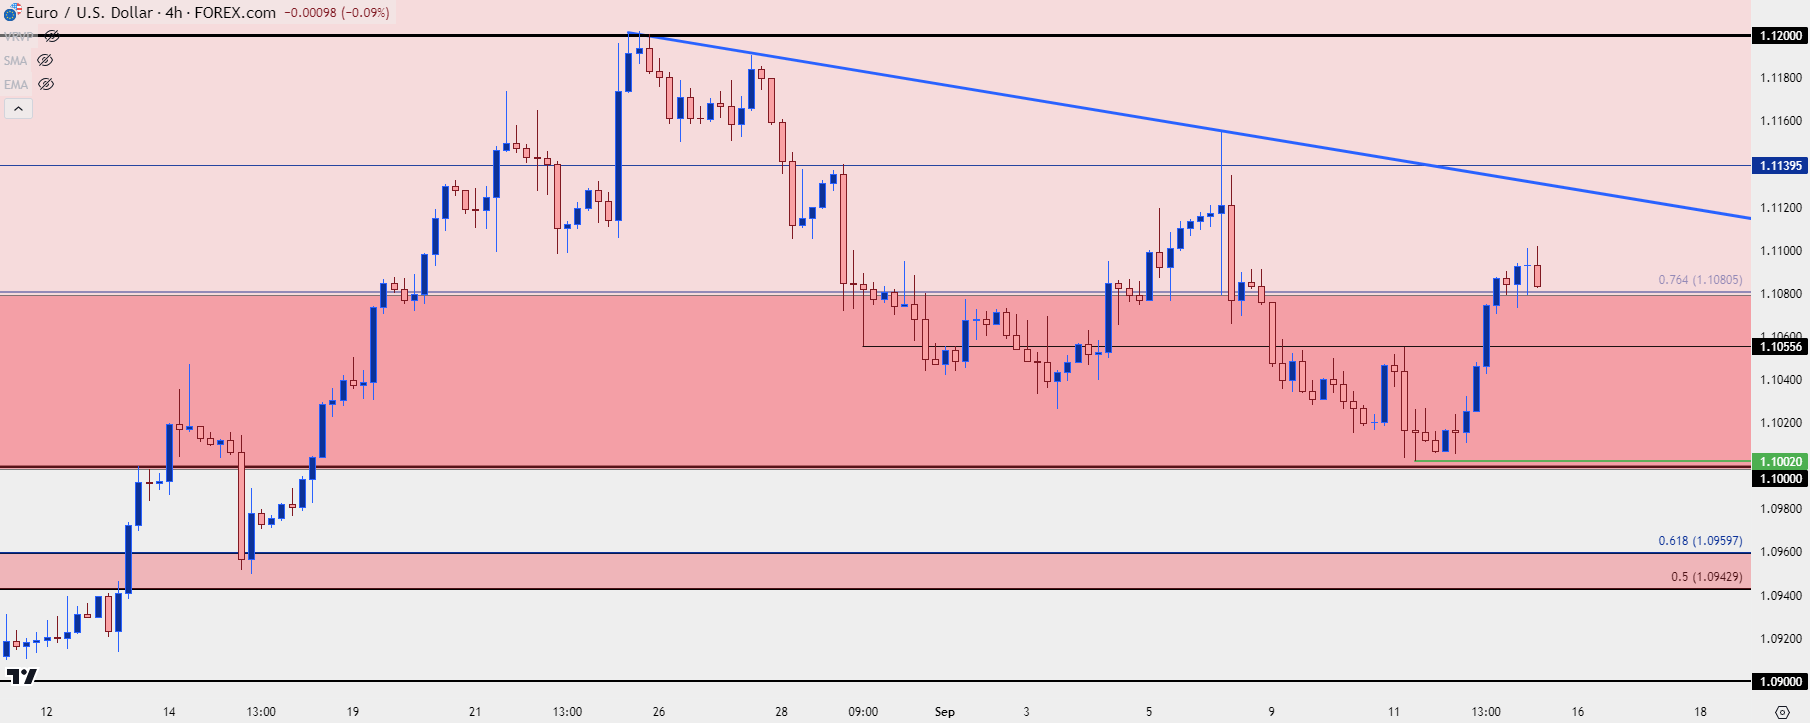
The fundamental case for such a move was lacking as the European Central Bank remains in a dovish position, with more rate cuts likely to follow the most recent adjustment on Thursday. And for the early part of the past week, it looked as though EUR/USD bears might be able to force a push. But the 1.1000 level proved to be a tough level for bears to beat as support showed two pips-above ahead of the ECB meeting, which then led to a strong bounce after the bank’s rate cut announcement.
At this point from the four-hour chart, we can see where this produced a higher-high above the prior lower-high. This is shorter-term but, it does provide some scope for buyers if they can defend that structure to make another forward push towards 1.1140 or perhaps even the 1.1200 level that turned-around price a few weeks ago.
EUR/USD Four-Hour Price Chart
 Chart prepared by James Stanley, EUR/USD on Tradingview
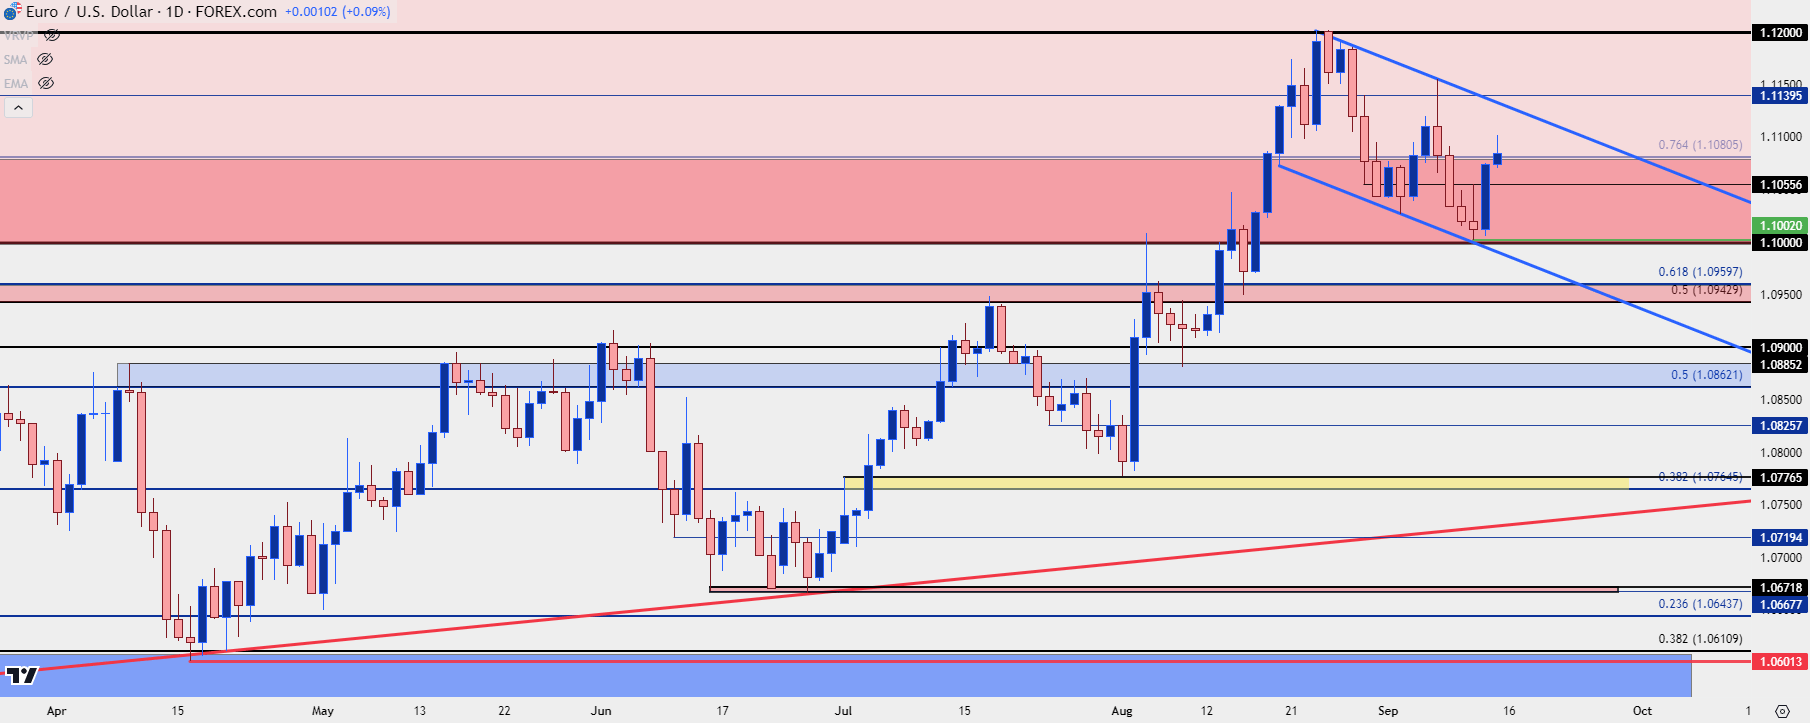
EUR/USD Daily: Possible Bull Flag
Taking a step back we can see some symmetry between recent support and resistance, helping to establish a channel. This could add some enthusiasm on the long side but the key will be a bullish breach of the formation, which also highlights the importance of 1.1140. And, shorter-term, the 1.1081 level.
Of course, for this formation to fill, we’ll likely need to see some continued USD-weakness and with FOMC on the calendar for next week, the range of possible outcomes widens significantly. The question there will likely go back to the Fed’s dot plot matrix and how many cuts the bank is looking to push for the rest of this year and through 2025 trade.
EUR/USD Daily Price Chart
 Chart prepared by James Stanley, EUR/USD on Tradingview
EUR/USD Big Picture
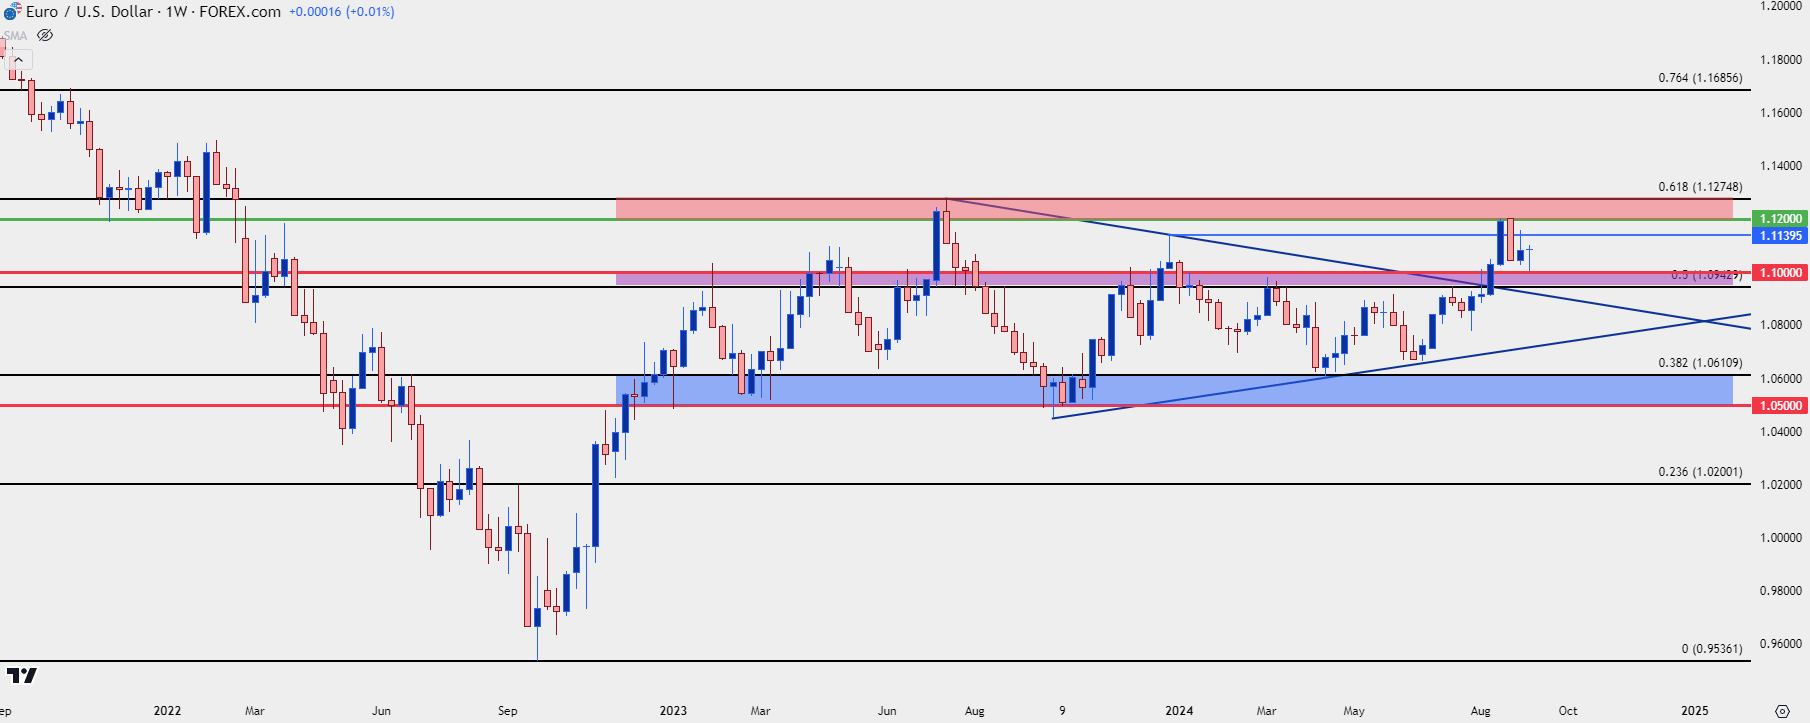
At this point, the case can still be made that EUR/USD exists within a year-and-a-half long range. Last year’s high printed right at the 61.8% Fibonacci retracement of the 2021-2022 major move at 1.1275, and that becomes the next major level in bullish scenarios for the pair in which buyers are able to push a break above the 1.1200 level that held the highs a few weeks ago.
This also places more importance on the 1.0943-1.1000 zone, which has so far exhibited support at prior resistance. If bulls fail to hold that then range continuation scenarios remain in-play.
EUR/USD Weekly Price Chart
 Chart prepared by James Stanley, EUR/USD on Tradingview
--- written by James Stanley, Senior Strategist


