Asian Indices:
- Australia's ASX 200 index fell by -27.8 points (-0.38%) and currently trades at 7,356.70
- Japan's Nikkei 225 index has fallen by -152.16 points (-0.51%) and currently trades at 28,579.91
- Hong Kong's Hang Seng index has fallen by -122.01 points (-0.5%) and currently trades at 24,132.85
- China's A50 Index has fallen by -76.14 points (-0.47%) and currently trades at 16,235.93
UK and Europe:
- UK's FTSE 100 futures are currently down -20.5 points (-0.28%), the cash market is currently estimated to open at 7,300.76
- Euro STOXX 50 futures are currently down -12 points (-0.29%), the cash market is currently estimated to open at 4,196.30
- Germany's DAX futures are currently down -36 points (-0.23%), the cash market is currently estimated to open at 15,603.26
US Futures:
- DJI futures are currently down -11 points (0%)
- S&P 500 futures are currently up 15.25 points (0.09%)
- Nasdaq 100 futures are currently up 3.25 points (0.07%)
Asian equities were lower ahead of key inflation data today, with Japan’s share markets leading the way lower. Wholesale inflation in Japan rose to a record high of 9% as it expanded for a ninth consecutive month.

A (very well broadcast) US inflation report is today's main event
It goes without saying that today’s inflation report in the US is the main event. It hit a 30-year high in October and expectations are for those numbers to be inflated further. We can see today’s report as a proxy for next week’s Federal reserve meeting, because the hotter inflation is the more pressure it piles on the Fed to increase their pace of tapering. Core CPI is forecast to rise to a new 30-year high of 4.9% y/y and 0.5% m/m, whilst broad CPI (including food and energy) is expected to rise to 6.8% from 6.2%. These are not small numbers. And if the data is to exceed these high bars it’s likely a dollar bullish case as bets are on for a faster pace of tapering to be announced next week.
However, the data set has had a lot of airtime recently, to the point where anything short of an above-expectation print could lead to disappointment. Therefore, the contrarian in me things the better play is for a surprise miss, or even something simple as coming in as expected
Why we prefer gold on a strong inflation print (and silver for a miss)
Silver is trying to grapple $22 ahead of the data and it is clearly a pivotal level around it. The only ‘downside’ to its potential downside is that the September 2020 and 2021 lows are nearby, so we’d likely need a really strong print for bears to break prices below them with any conviction. Therefore, we prefer gold from a tactical viewpoint should inflation beat expectations as it could have a clear run down to 1758. Conversely, silver looks quite appealing around $22 should inflation undershoot already high expectations.
US dollar continues to coil
The US dollar index has been coiling in an ever-tightening triangle since its November high. This means at some point volatility will rear its ugly head at some point, although its directional break is yet to be seen. But we know that inflation data (and or) next week’s FOMC meeting are prime candidates for such a catalyst.
And if the dollar index us coiling, so is EUR/USD. 1.13 is clearly the pivotal level for today and inflation is the missing link for which side of 1.13 it closed today. Euro bulls need a miss to break above 1.13 and target the 1.1382 highs ahead of the 1.14 handle. But we cannot lose sight of the fact it is within a strong downtrend on the daily chart and 1.12 could be within easy reach by next week should inflation do its job and rise.
Oil? Give me a break

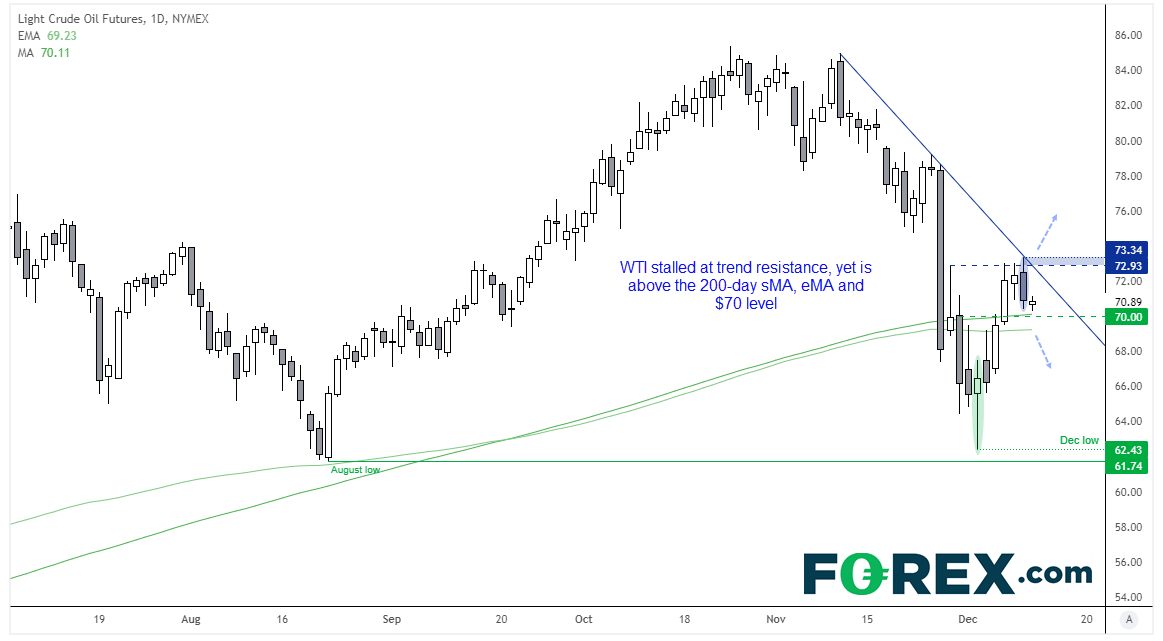
WTI finds itself in a similar scenario to AUD/JPY. Both markets have rallied with risk sentiment and paused at trend resistance as they wait their next catalyst. Bulls might take solace from the fact that prices had a strong rally above the August low with a bullish pinbar, and that yesterday’s bearish candle is holding above the 200-day sMA and eMA. Should these support levels hold then a break above yesterday’s high invalidates trend resistance and assumes bullish continuation. Bears may want to wait for a break below the 200-day sMA as it also breaks $70 before assuming a deeper pullback against its recent rally.
How to start oil trading
FTSE 100 remains buoyant below 7400
The FTSE 100 closed lower for a second session as mean reversion kick in, but we have to admit that its lack of bearish follow-through could be taken as a sign of strength. We didn’t expect bulls to break above 7400 / November highs on their first attempt based on the premise that traders would want to book profits after a strong rally. Still, a weaker pound and equity-friendly sentient of late has clearly helped the FTSE, so we’ll look for evidence of a swing low before reconsidering potential longs.
FTSE 350: Market Internals
FTSE 350: 4188.34 (-0.22%) 09 December 2021
- 131 (37.32%) stocks advanced and 206 (58.69%) declined
- 9 stocks rose to a new 52-week high, 3 fell to new lows
- 54.99% of stocks closed above their 200-day average
- 55.56% of stocks closed above their 50-day average
- 21.94% of stocks closed above their 20-day average
Outperformers:
- + 4.86% - Volution Group PLC (FAN.L)
- + 4.81% - Frasers Group PLC (FRAS.L)
- + 4.47% - Moonpig Group PLC (MOONM.L)
Underperformers:
- -11.84% - Harbour Energy PLC (HBR.L)
- -5.70% - FirstGroup PLC (FGP.L)
- -4.90% - ConvaTec Group PLC (CTEC.L)
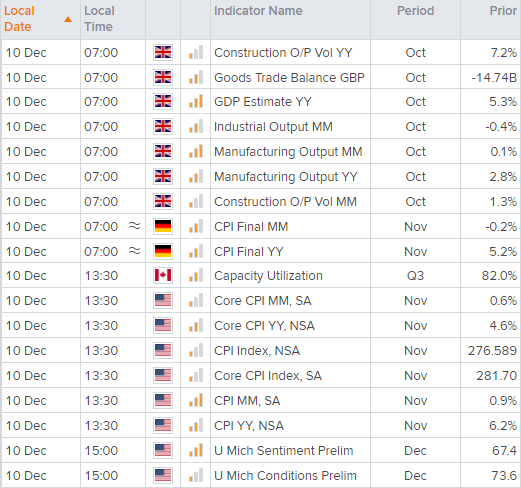
Up Next (Times in GMT)
What are economic indicators?
How to trade with FOREX.com
Follow these easy steps to start trading with FOREX.com today:
- Open a Forex.com account, or log in if you’re already a customer.
- Search for the pair you want to trade in our award-winning platform.
- Choose your position and size, and your stop and limit levels.
- Place the trade.


