
Asian Indices:
- Australia's ASX 200 index rose by 9.8 points (0.14%) and currently trades at 6,986.70
- Japan's Nikkei 225 index has fallen by -22.77 points (-0.08%) and currently trades at 27,656.15
- Hong Kong's Hang Seng index has risen by 383.74 points (2.48%) and currently trades at 15,839.01
- China's A50 Index has risen by 221.48 points (1.89%) and currently trades at 11,909.15
UK and Europe:
- UK's FTSE 100 futures are currently up 20 points (0.28%), the cash market is currently estimated to open at 7,206.16
- Euro STOXX 50 futures are currently up 23 points (0.63%), the cash market is currently estimated to open at 3,674.02
- Germany's DAX futures are currently up 83 points (0.62%), the cash market is currently estimated to open at 13,421.74
US Futures:
- DJI futures are currently up 58 points (0.18%)
- S&P 500 futures are currently up 42.75 points (0.38%)
- Nasdaq 100 futures are currently up 10.75 points (0.28%)
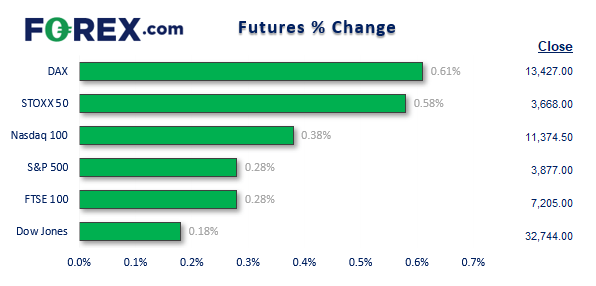
The is Volatility Index (VIX) – daily chart:
The VIX – sometimes referred to as the fear index – generally rises during times of uncertainty and falls as investors become more optimistic about the future. It’s a measure of volatility expectations over the next 30-day for the S&P 500, derived for the S&P futures options market. It also trades inversely to the S&P 500, so a higher VIX means a lower S&P500. Portfolio managers use to assess how much leverage to use on their portfolios (if any at all), and traders can use it to gauge sentiment for the market overall.
The VIX reached a relatively high of around 35 in September and October as fear gripped the market. Yet it has drifted lower since mid-October as tensions have eased (and hopes have arisen that central banks will tighten at a slower pace).
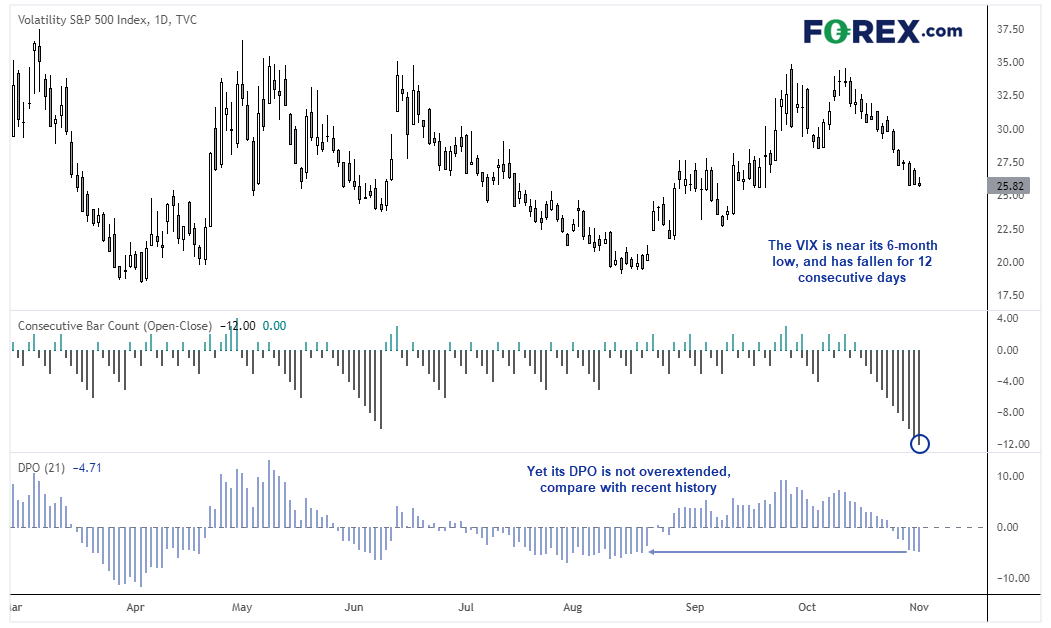
But what has really caught my eye is how the VIX has fallen for 12 consecutive sessions – a sequence not achieved sine 2019 – and that it sits near a 6-week low ahead of today’s highly anticipated FOMC meeting.
Remember, volatility is bipolar and shifts between cycle of high and low volatility. We are headed into one of the more important FOMC meetings as traders want to hear if the Fed will slow down their pace of tightening. And it appears as though relative level of complacency is in the air, so we could be fast approaching a rise of volatility for global markets.
What if the Fed don’t hint at a slower pace of hikes?
This scenario is entirely possible, and something equity traders seem not to be paying attention to as equities continue to rally from their October lows. The Dow had its best month in over 40 years, which is not bad considering the economic backdrop.
As things stand there’s an ~85% chance of a 75bp hike today – which is practically a given – and the Fed generally go with market consensus when its over 70% anyway. So today is about whether they hint at a 50 or 75bp hike at their December meeting. Currently odds are at 44.7% for 50 and 49.2% for 75. Should they hint at 50, my guess is that the dollar will suffer and equities will extend their rally. But as I suspect equities are placing grater odds (or hope) that they’ll go with 50 in December, any hint that they won’t slow their pace could weigh on stocks in general and help further support the dollar.
S&P 500 4-hour chart:
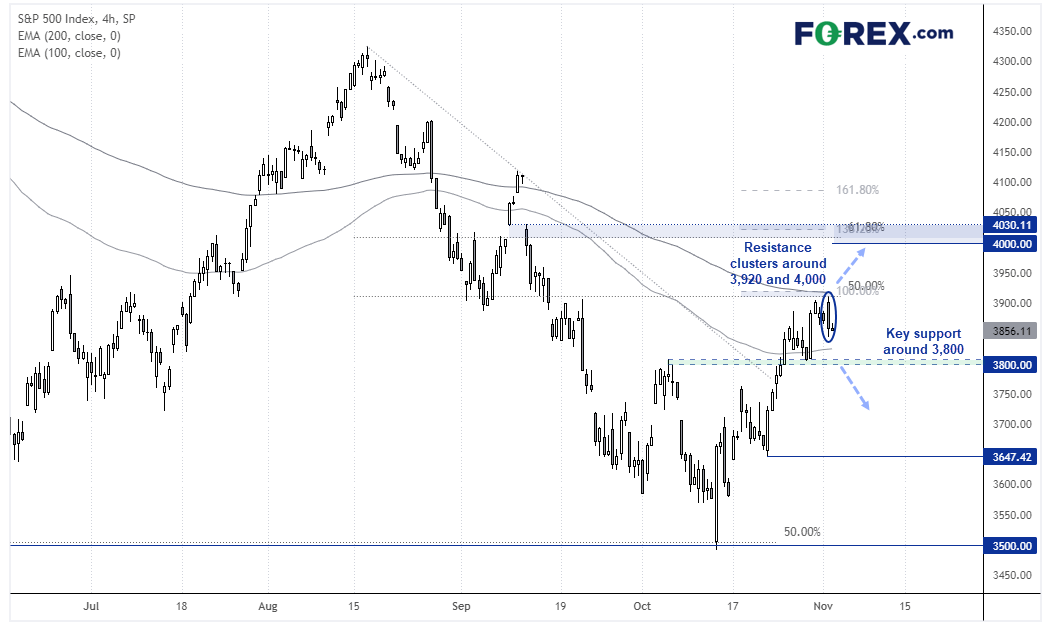
The S&P 500 finds itself at a technical juncture ahead of today’s meeting. Its 12.7% rally stalled around 3900, which is near the 100-bar EMA, 50% retracement and 100% projection level. A bearish engulfing candle formed, which raises the potential for a pullback to 3800 – a break beneath which assumes an important swing high has already been seen.
Should we see prices break above this week’s high, the resistance cluster around 4000 – 4030 comes into focus, which includes a 138.2% projection and 61.8% Fibonacci ratio, and a 200-bar EMA. And with the key levels marked out, it is now down to what the Fed do (or not) as to why way prices will likely break.
DAX 4-hour chart:
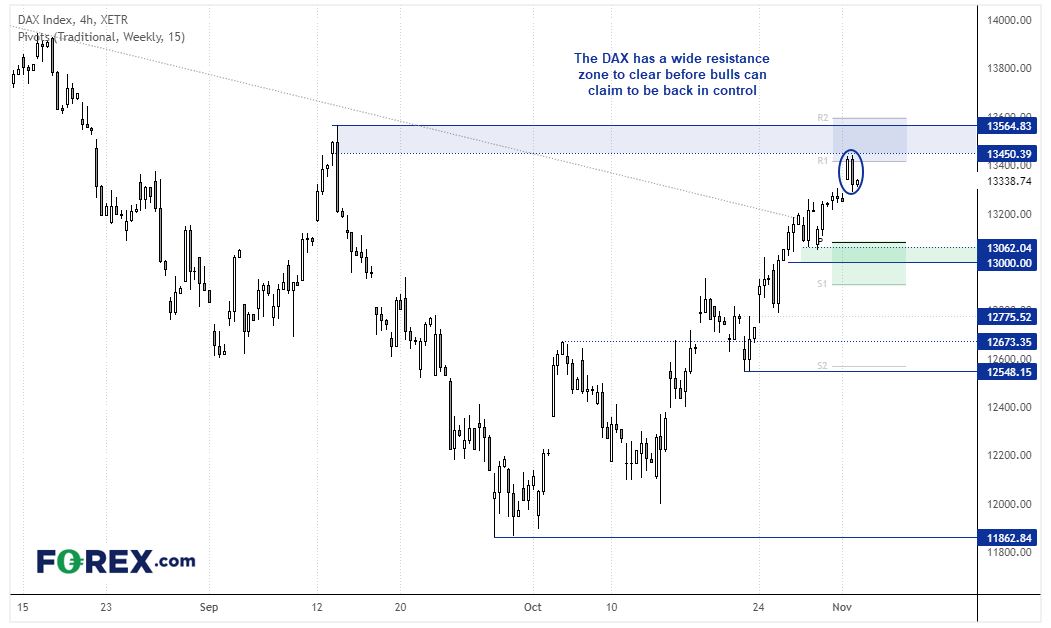
Correlations will likely be high across markets, so where the S&P 500 travels the DAX is likely to follow. Yet given its close proximity to a wide resistance zone, the DAX may be more appealing to bearish eyes should the Fed provide a hawkish meeting, with 13,200 and 13,000 making potential areas for them to target. Whereas a break above 13,600 assumes its bullish trend continues.
FTSE 350 Performance:
FTSE 350: 3967.63 (0.66%) 01 November 2022
- 229 (65.43%) stocks advanced and 112 (32.00%) declined
- 9 stocks rose to a new 52-week high, 1 fell to new lows
- 12.57% of stocks closed above their 200-day average
- 50.57% of stocks closed above their 50-day average
- 5.43% of stocks closed above their 20-day average
Outperformers:
- + 38.57% - Ocado Group PLC (OCDO.L)
- + 10.44% - Auction Technology Group PLC (RBDR.L)
- + 10.17% - Tullow Oil PLC (TLW.L)
Underperformers:
- -4.41% - Ferrexpo PLC (FXPO.L)
- -4.38% - Helios Towers PLC (HTWS.L)
- -4.30% - Rentokil Initial PLC (RTO.L)
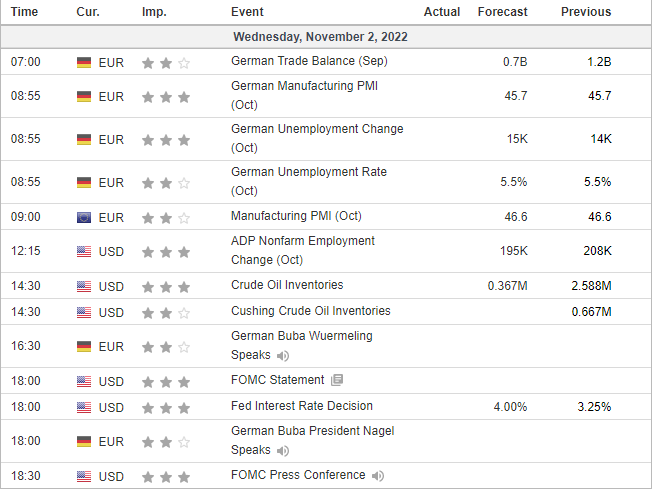
Economic events up next (Times in BST)
How to trade with FOREX.com
Follow these easy steps to start trading with FOREX.com today:
- Open a Forex.com account, or log in if you’re already a customer.
- Search for the pair you want to trade in our award-winning platform.
- Choose your position and size, and your stop and limit levels.
- Place the trade.


