Asian Indices:
- Australia's ASX 200 index rose by 27.4 points (0.37%) and currently trades at 7,466.30
- Japan's Nikkei 225 index has fallen by -236.91 points (-0.82%) and currently trades at 28,528.75
- Hong Kong's Hang Seng index has risen by 19.66 points (0.08%) and currently trades at 24,421.83
- China's A50 Index has fallen by -77.97 points (-0.5%) and currently trades at 15,433.17
UK and Europe:
- UK's FTSE 100 futures are currently down -1.5 points (-0.02%), the cash market is currently estimated to open at 7,550.22
- Euro STOXX 50 futures are currently down -4 points (-0.09%), the cash market is currently estimated to open at 4,312.39
- Germany's DAX futures are currently down -10 points (-0.06%), the cash market is currently estimated to open at 16,000.32
US Futures:
- DJI futures are currently down -45 points (-0.12%)
- S&P 500 futures are currently down -42 points (-0.26%)
- Nasdaq 100 futures are currently down -8 points (-0.17%)

There wasn’t a clear directional bias across Asian markets overnight. But the same could be said on US and European markets yesterday after their early rallies faltered and bullish gaps were then filled. So with the big data behind us for the week investors seem to be looking for their next catalyst, and with a lack of European data it could be a case of every market for itself until the US opens. Futures markets have opened slightly lower, but we’re not reading too much into it.
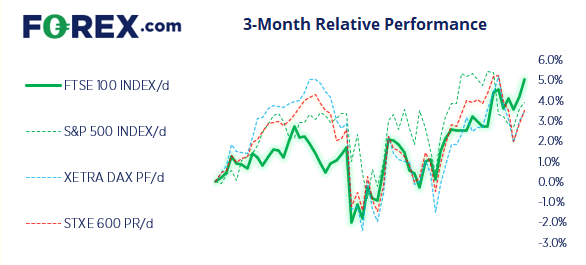
The FTSE 100 reached our initial target around 7550 yesterday (near the weekly and monthly R1 pivot) but resistance was found at the upper trend channel. However, the daily trend structure is firmly bullish so are open to a move to 7600 (perhaps even today) should sentiment allow.
FTSE 100 trading guide
FTSE 350: Market Internals

FTSE 350: 4294.04 (0.81%) 12 January 2022
- 186 (52.84%) stocks advanced and 148 (42.05%) declined
- 15 stocks rose to a new 52-week high, 5 fell to new lows
- 52.84% of stocks closed above their 200-day average
- 47.44% of stocks closed above their 50-day average
- 15.91% of stocks closed above their 20-day average
Outperformers:
- + 7.96% - Savills PLC(SVS.L)
- + 7.49% - Antofagasta PLC(ANTO.L)
- + 6.79% - Games Workshop Group PLC(GAW.L)
Underperformers:
- -8.17% - TP ICAP Group PLC (TCAPI.L)
- -7.00% - Hill & Smith Holdings PLC (HILS.L)
- -4.80% - Taylor Wimpey PLC (TW.L)
Gold strikes a 4-day rally, yet resistance hovers nearby
Gold has risen for four consecutive trading days, which is the first time it has achieved that run since November. It appears that gold is behaving like an inflationary hedge at long last, but we’re also mindful that it is headed into strong resistance around $1835. In fact, considering yesterday’s bullish day was its least volatile of the past three days, bullish momentum I clearly waning. So if it can reach $1835 today then great, but we’re mindful that its an obvious place to book profits unless we get a new catalyst.
The pound struggles against commodity currencies
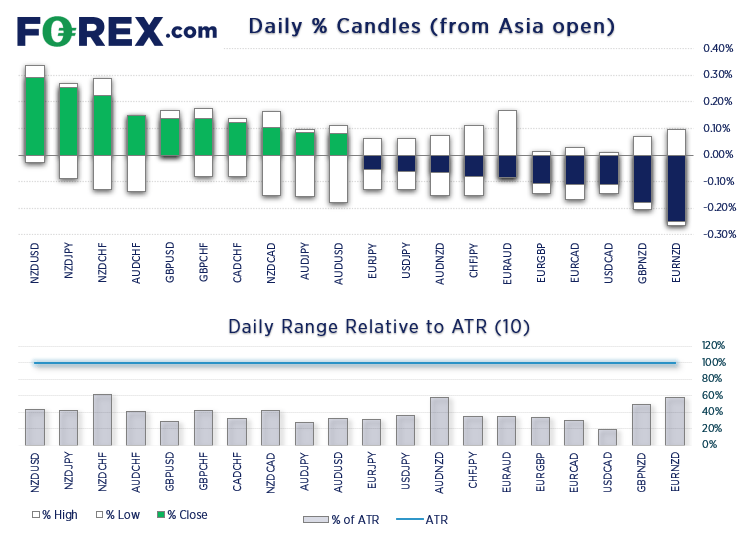
Whilst GBP has extended its impressive rally against the US dollar, the same cannot be said against AUD and NZD. Both GBP/AUD and GBP/NZD have seen strong rallies of their own but they ventured into overbought territory and now momentum has turned against them. With them trading back below their prior cycle highs a corrective phase is underway, leaving the option to countertrend trade or step aside and wait for a level of support to build and re-join their dominant, bullish trends on the daily chart.EUR/USD probes key trendline
The euro’s rally stalled at a key trendline projected from the June high overnight, so we now get to see whether we’ve seen a high or this move countertrend move has some legs. Irrespective of a directional bias, it is refreshing to see the euro breakout after two months of sideways trading. But we remain wary over how much upside potential remains, given the backdrop of negative yield differentials between Europe and the US. Granted, it has the potential to hit 1.1500 or retest the November lows around 1.1530 over the near-term, purely on a momentum play. But with ECB is denial whilst the Fed embrace inflationary pressures, it’s hard to be too bullish on the euro overall, so we’ll let this countertrend move play out before seeking new shorts.
Guide to Pound sterlingAUD/CAD set to rally?

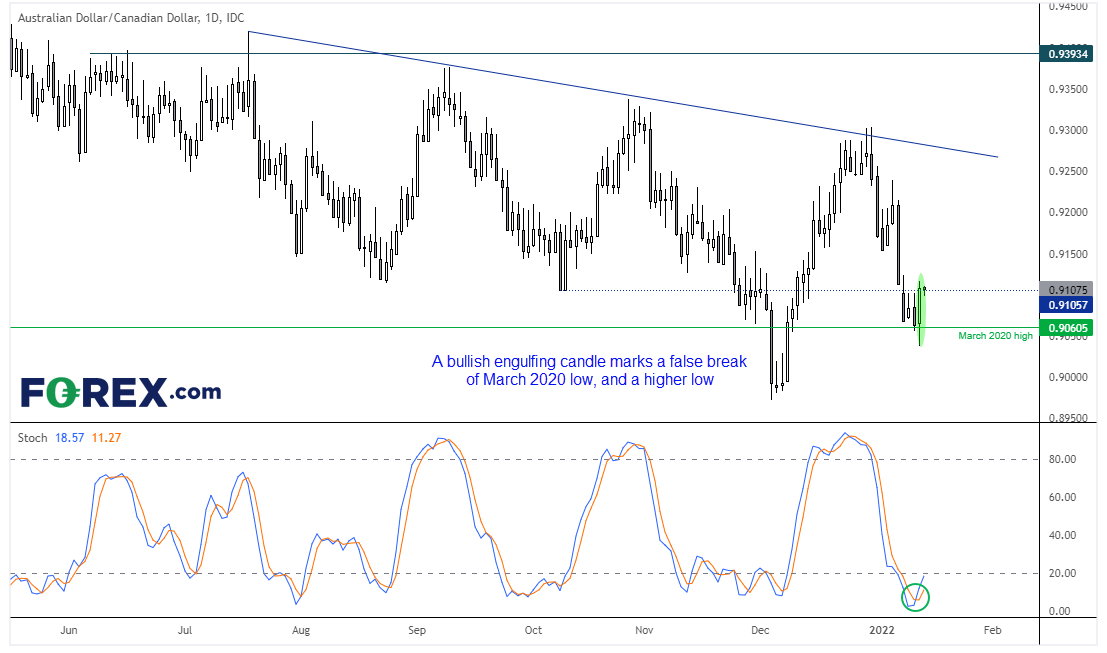
This commodity cross has provided some decent swings over the past seven months on the daily chart of around 250 – 350 pips. And it has grabbed our attention for a potential long after printing a bullish engulfing candle at the March 2020 high. This is a level of significance as it marks the top of the violent whipsaw seen at the height of the pandemic, and the fact yesterday’s candle coincides with a stochastic buy signal and also forms a higher high could make it of interest for a bullish swing trade. Therefore, our bias remains bullish above yesterday’s low and would be keen on any pullbacks within yesterday’s range, that hold above 0.9060. We’d have an open upside target (given size of potential swings) although initial resistance sits at 0.9150.
Up Next (Times in GMT)

How to trade with FOREX.com
Follow these easy steps to start trading with FOREX.com today:
- Open a Forex.com account, or log in if you’re already a customer.
- Search for the pair you want to trade in our award-winning platform.
- Choose your position and size, and your stop and limit levels.
- Place the trade.


