
Asian Indices:
- Australia's ASX 200 index rose by 113.6 points (1.71%) and currently trades at 6,756.20
- Japan's Nikkei 225 index has risen by 880.79 points (3.36%) and currently trades at 27,118.21
- Hong Kong's Hang Seng index has risen by 553.06 points (3.37%) and currently trades at 16,942.17
- China's A50 Index has risen by 277.29 points (2.21%) and currently trades at 12,798.81
UK and Europe:
- UK's FTSE 100 futures are currently up 59.5 points (0.87%), the cash market is currently estimated to open at 6,909.77
- Euro STOXX 50 futures are currently up 58 points (1.73%), the cash market is currently estimated to open at 3,420.40
- Germany's DAX futures are currently up 230 points (1.86%), the cash market is currently estimated to open at 12,585.58
US Futures:
- DJI futures are currently up 171 points (0.57%)
- S&P 500 futures are currently up 62.5 points (0.56%)
- Nasdaq 100 futures are currently up 22.75 points (0.62%)
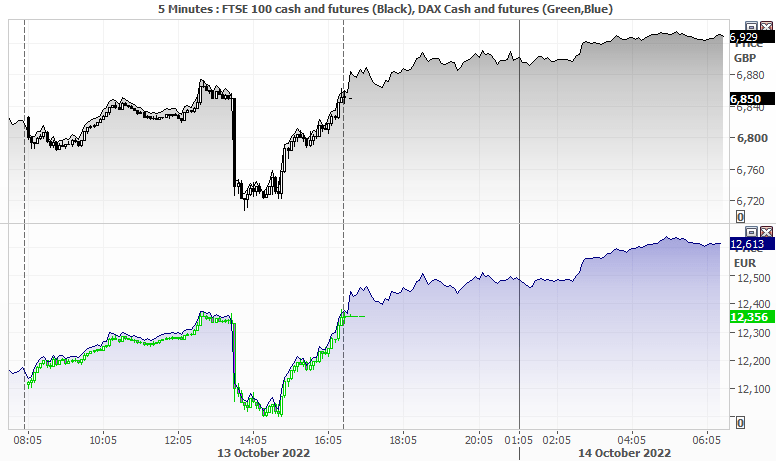
Asian equity market tracked Wall Street higher with the Hang Seng and TOPIX taking the lead. AUD and NZD were also the strongest majors as they extended yesterday’s countertrend moves – which are arguably a function of short-covering, although sentiment is also buoyant as fears over the UK gilt crisis has eased.
DAX daily chart:
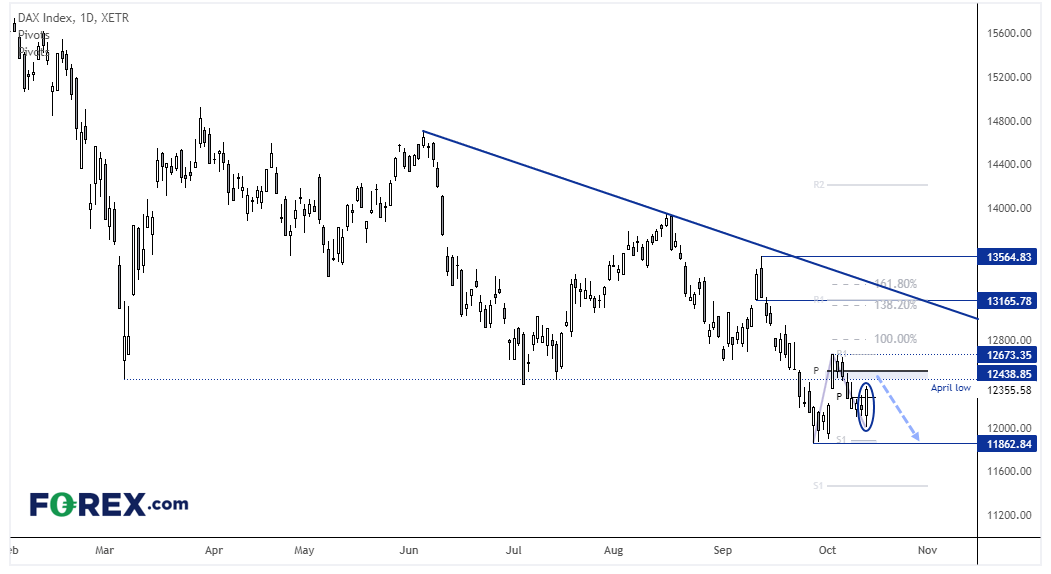
Like most global equity markets, the DAX saw a solid close yesterday as markets covered shorts following a strong inflation report from the US. The bullish engulfing day marks a higher low and futures markets point to a positive open for the cash market today.
It is difficult to say how much upside potential there is left for any short-covering, and currently difficult to construct a sustainable bullish case (other than saying markets are oversold so need a correction).
For today we want to see how prices react around the monthly pivot, as the ‘rally’ could peter out and form a swing high before turning lower. And we’d only be seeking bullish setups on very low intraday timeframes, given the 12,673 high is so close to the monthly pivot point (which makes the reward to risk ratio unworkable for the daily chart). However, should price break above 12,674 then a deeper countertrend move higher is assumed.
DAX 30 trading guide
WTI 4-hour chart:
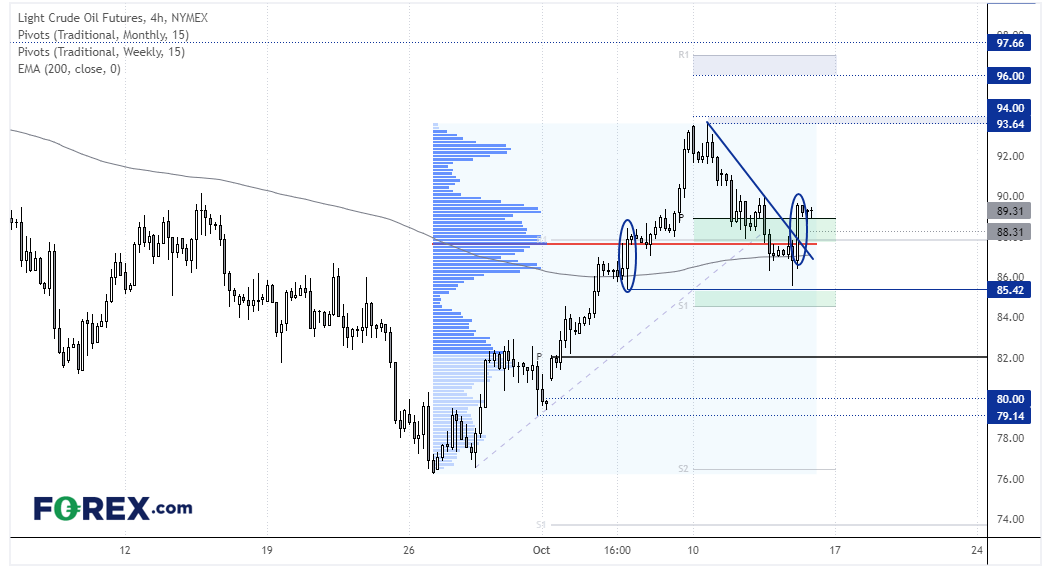
Following a 3-day pullback from 93.64, WTI produced a bullish engulfing candle on the daily chart which closed back above the 20-day EMA . Given the strength of the rally from the 76.30 low, we suspect a corrective low has been found.
The 4-hour chart shows that there was a lot of trading activity around 87.60 since the September low (which marks the volume POC / point of control). But also note that yesterday's low held above a previous bullish engulfing candle on the 4-hour chart, rebounded above the 200-bar EMA and a bullish engulfing candle closed firmly above trend resistance. Prices are pulling back in Asia so we're now looking for opportunities to enter long above the 88.0 area / monthly R1 pivot point and anticipate prices to retest the 94 highs and head for 96 - or even the high around 97.66.
FTSE 350 – Market Internals:
FTSE 350: 3768.96 (0.35%) 13 October 2022
- 270 (77.14%) stocks advanced and 75 (21.43%) declined
- 0 stocks rose to a new 52-week high, 76 fell to new lows
- 12.29% of stocks closed above their 200-day average
- 63.14% of stocks closed above their 50-day average
- 2.86% of stocks closed above their 20-day average
Outperformers:
- + 10.86% - Ocado Group PLC (OCDO.L)
- + 9.55% - TI Fluid Systems PLC (TIFS.L)
- + 8.28% - Virgin Money UK PLC (VMUK.L)
Underperformers:
- -4.08% - Fresnillo PLC (FRES.L)
- -3.34% - TP ICAP Group PLC (TCAPI.L)
- -3.13% - Halma PLC (HLMA.L)
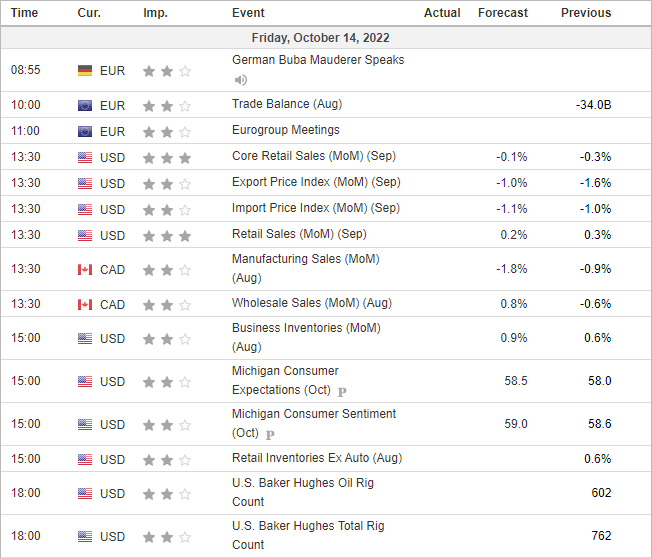
Economic events up next (Times in BST)
How to trade with FOREX.com
Follow these easy steps to start trading with FOREX.com today:
- Open a Forex.com account, or log in if you’re already a customer.
- Search for the pair you want to trade in our award-winning platform.
- Choose your position and size, and your stop and limit levels.
- Place the trade.


