Euro Technical Forecast: EUR/USD Weekly Trade Levels
- Euro rebound off key yearly-open support now approaching technical pivot zone
- EUR/USD bulls threatens breakout of 2023 opening-range, risk for major price inflection
- Resistance 1.1033/70 (key), 1.1148, 1.1275– support 1.0850, 1.0667-1.0705, 1.0483/99
Euro is attempting to mark a third weekly advance with a rally of more than 1.7% off the monthly low now poised for test of critical resistance near the yearly range highs- threat for some major price inflection here. These are the updated targets and invalidation levels that matter on the EUR/USD weekly technical chart.
Review my latest Weekly Strategy Webinar for an in-depth breakdown of this EUR/USD technical setup and more. Join live on Monday’s at 8:30am EST.
Euro Price Chart – EUR/USD Weekly

Chart Prepared by Michael Boutros, Technical Strategist; EUR/USD on TradingView
Technical Outlook: In last month’s Euro Technical Forecast, we noted that EUR/USD had, “rebounded off technical support around the yearly open with the advance now approaching downtrend resistance. From a trading standpoint, look to reduce long-exposure / raise protective stops on a stretch towards 1.0919- losses should be limited to 1.07 IF price is heading higher with a topside breach needed to fuel another run on the yearly highs.” Euro has now rallied nearly 3.7% off those lows with the advance once again within striking distance of key resistance near the 2023 highs.
The zone in focus remains 1.1033/70- a region defined by the January range highs, the 2023 high-week close, and the 23.6% retracement of the broader 2008 decline. A breach / close above this threshold is needed to fuel the next leg in price towards subsequent resistance objectives at the upper bounds of this yearly rising wedge formation near ~1.1148 and the key 61.8% Fibonacci retracement of the 2021 decline at 1.1275.
Initial weekly support rests with the May weekly-reversal close at 1.0850 with a break / close below the 2023 low-week close / yearly open at 1.0667-1.0705 ultimately needed to mark resumption of the boarder downtrend towards the yearly lows near ~1.05.
Bottom line: The Euro rally is approaching major resistance hurdles here into the yearly range-highs – risk for topside exhaustion / price inflection into 1.1033/70. From a trading standpoint, a good zone to reduce portions of long-exposure / raise protective stops – losses should be limited to 1.0850 IF price is heading higher on this stretch with a close above 1.1148 needed to fuel the next meaningful leg higher in price.
It’s important to note that failure into this pivot zone could spark another accelerated sell-off with the last two-tests of this threshold marking declines of more than 4.1%. Ultimately, we are looking for a breakout of this yearly rising wedge formation (red) in the weeks ahead for further conviction on our medium-term directional bias. I’ll publish an updated Euro Short-term Technical Outlook once we get further clarity on the near-term EUR/USD technical trade levels.
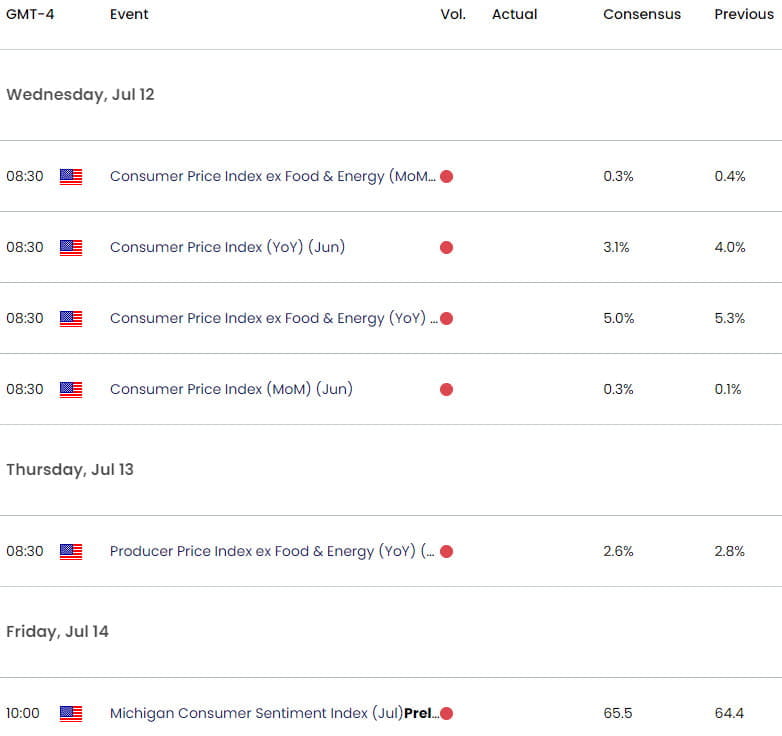
Key Euro / US Economic Data Releases

Economic Calendar - latest economic developments and upcoming event risk.
Active Weekly Technical Charts
- British Pound (GBP/USD)
- US Dollar (DXY)
- Australian Dollar (AUD/USD)
- Crude Oil (WTI)
- Gold (XAU/USD)
- Canadian Dollar (USD/CAD)
--- Written by Michael Boutros, Sr Technical Strategist with FOREX.com
Follow Michael on Twitter @MBForex


