Euro, EUR/USD Talking Points:
- EUR/USD had a bounce in early trade last week that was quickly faded on Friday.
- EUR/USD had started to show bearish tendencies in late-August and the question now is whether sellers can drive a deeper move. The 1.1000 level stands in the way as there hasn’t yet been much for support there since the breakout last month.
- I’ll be looking into these setups in the Tuesday webinar and you’re welcome to join, click here for registration information.
EUR/USD has continued to coil lower even after a two-and-a-half-day rally last week. The pair had started to show tendencies of bearish action in late-August, with both lower-lows and lower-highs appearing on the four-hour chart. That weakness held through last week’s open with sellers driving down to a low of 1.1026, with a pullback showing shortly after that drove all the way back to the resistance zone of 1.1140-1.1150 ahead of Non-farm Payrolls on Friday.
The response to the data was intense, and a stark contrast began to show in near-term price action. Bears returned to push price back down towards prior support but, once again, sellers have been unable to stretch down for a re-test of the psychologically important 1.1000 level.
EUR/USD Four-Hour Price Chart
 Chart prepared by James Stanley, EUR/USD on Tradingview
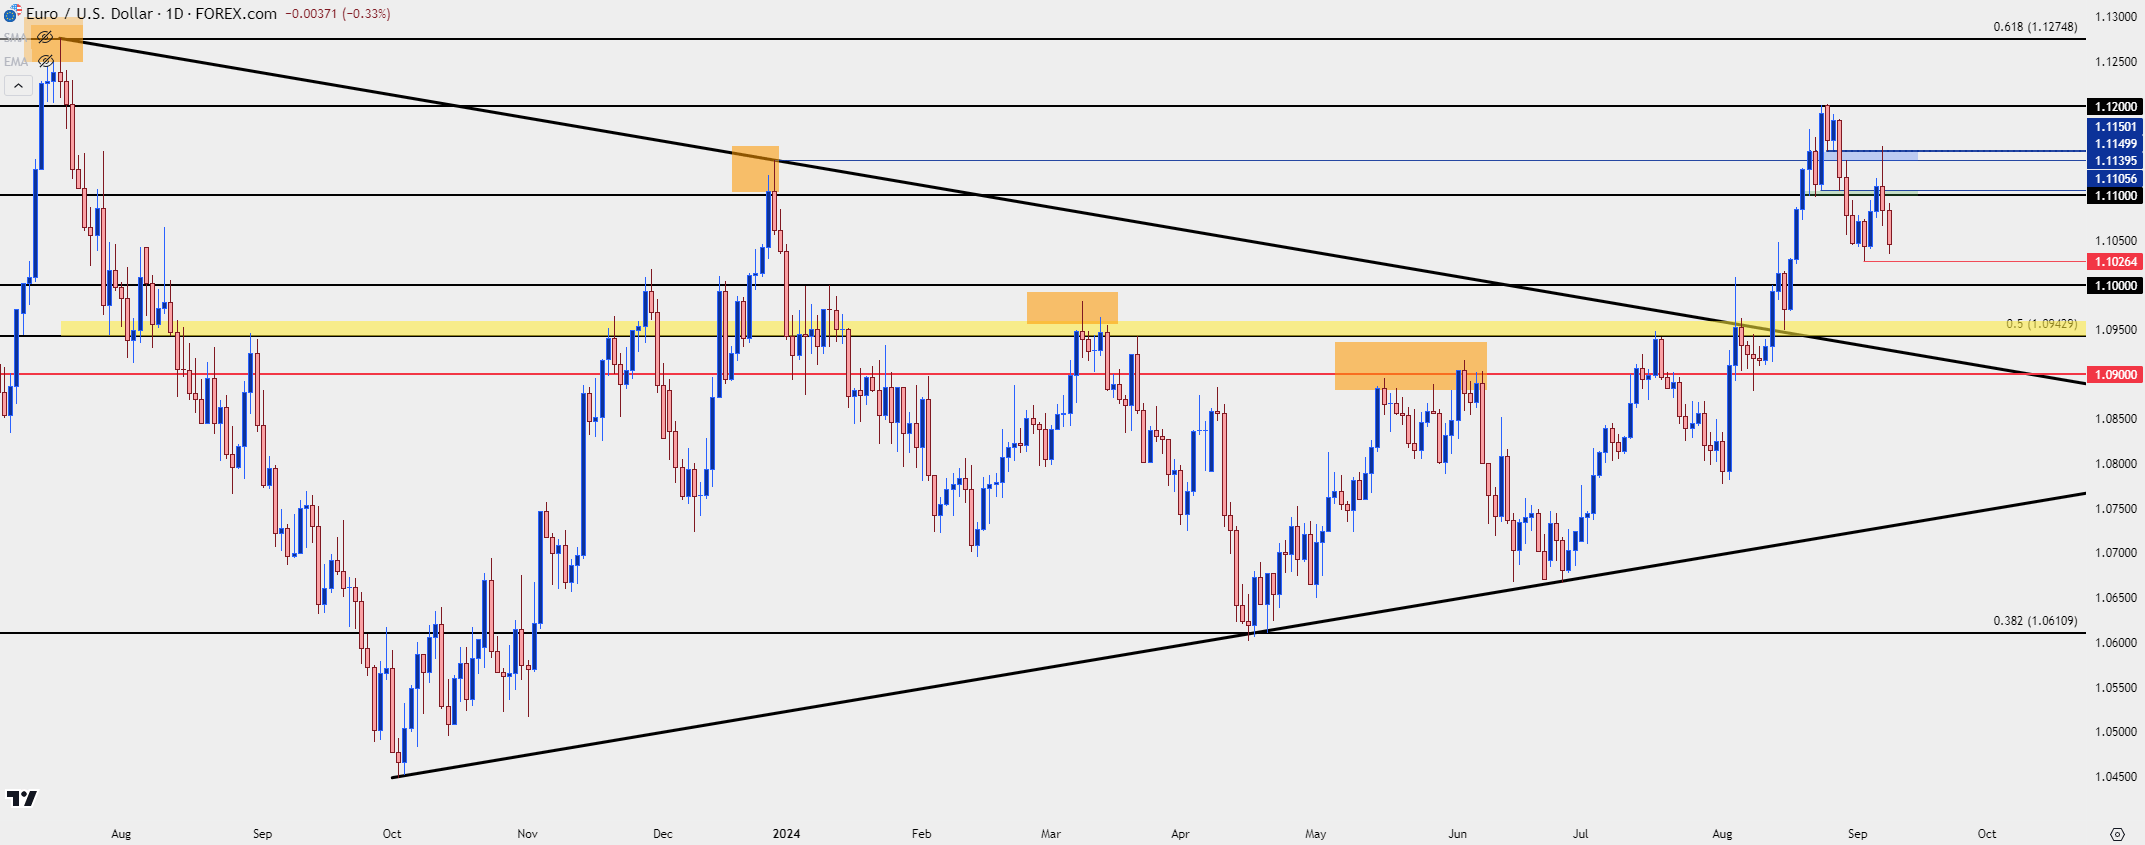
EUR/USD Daily
The big question now in my opinion is what happens at that next 1.1000 test. That’s been a major level in the pair through 2024 trade and until the August breakout, was highly contested. Interestingly there hasn’t been much for support there since the breakout, so bulls would have an open door for continuation if they can hold the pair at or around that level. An underside wick on a daily candle would be particularly interesting for such a scenario.
If sellers can drive through it, however, there’s another zone of support potential from prior resistance and this spans from the 1.0943-1.0960 area. The former price remains of importance as that’s the 50% mark from the same Fibonacci setup that held the highs in 2023 at the 61.8% level, and the low so far this year at the 38.2% retracement. In that scenario, the 1.1000 level could be re-purposed as lower-high resistance for bearish continuation setups.
EUR/USD Daily Price Chart
 Chart prepared by James Stanley, EUR/USD on Tradingview
--- written by James Stanley, Senior Strategist


