Euro, USD Talking Points:
- EUR/USD has shown a tendency towards weakness since hitting resistance at 1.1275 last month and this morning saw a test of a fresh low below the 1.0900 handle.
- That sell-off has since pared back and price is holding in a zone of support as taken from prior resistance. The door is open for bears and the question now is whether they come back in to continue the trend. There are some high impact European data items on the calendar for this week and that’ll likely remain a push point for that theme.
- In a related matter, the US Dollar has continued to breakout from the falling wedge pattern, which opens the door for longer-term bullish scenarios there, and this could continue to show a bearish drive in EUR/USD.
- I’ll be discussing these themes in-depth in the weekly webinar on Tuesday at 1PM ET. It’s free for all to register: Click here to register.
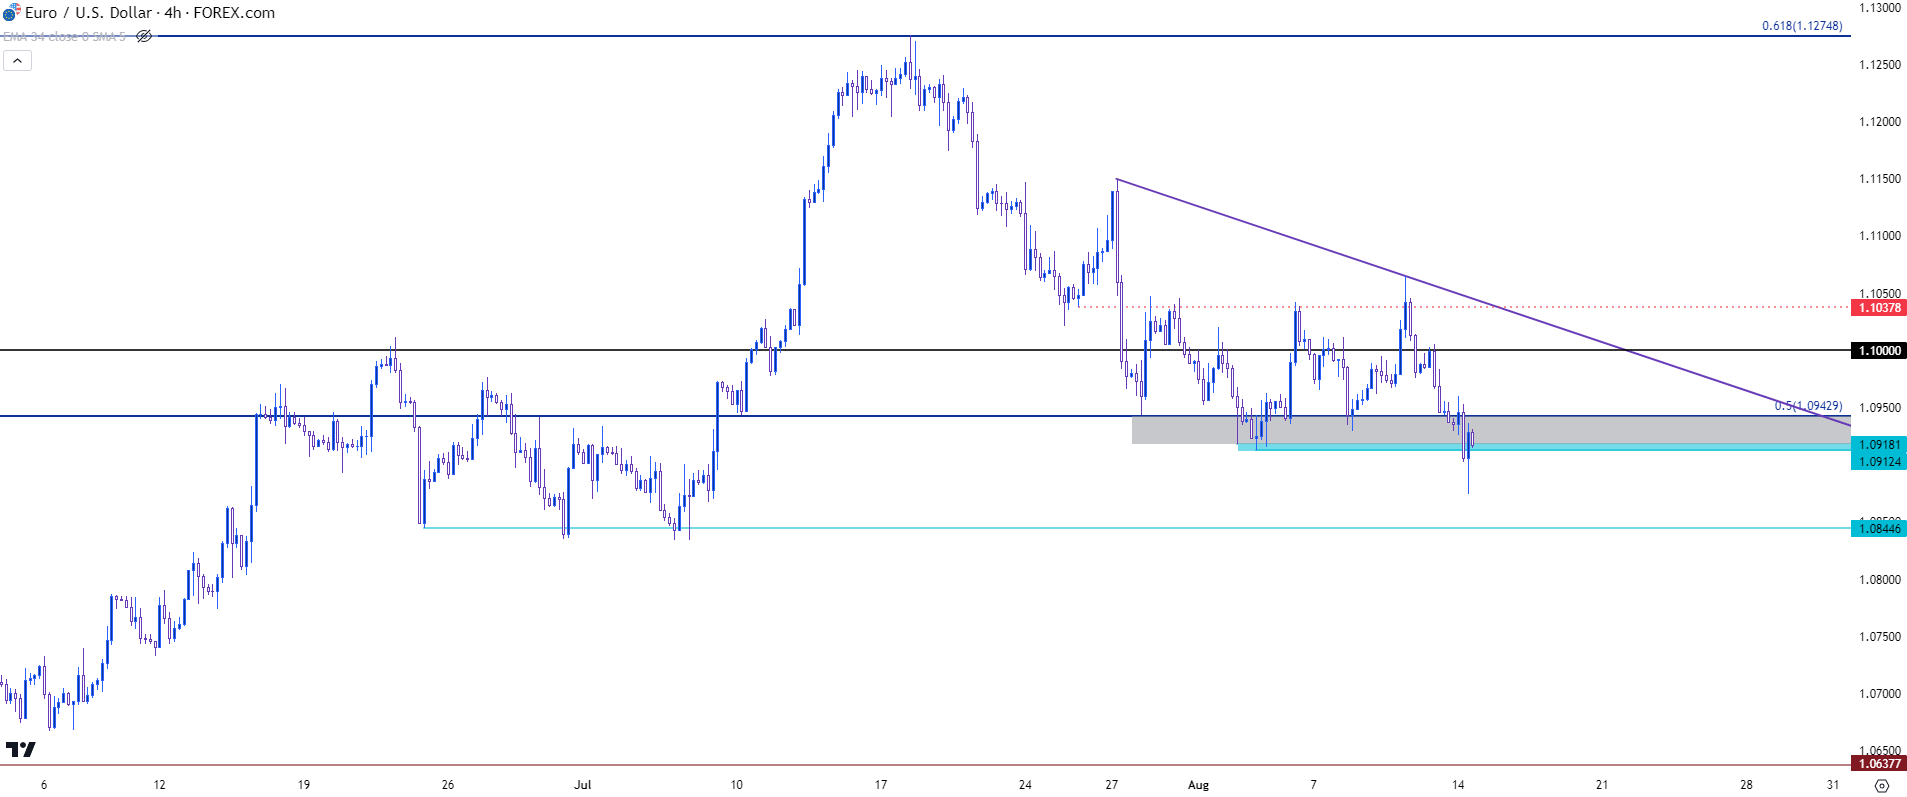
EUR/USD continues to show weakness and this morning brought another fresh low into the equation as sellers tested below the Fibonacci level at 1.0943. Bears were even able to push below 1.0900 but that move couldn’t last as prices have pulled back to that prior support zone.
At this stage, this highlights resistance potential at prior support, taken from the low last week up to the 1.0943 level. This keeps an open door for bears with the big question as to whether they can maintain the move. On the drivers front, the ZEW Sentiment Survey tomorrow could be key as it was a series of bad PMI reports last month that started to dim the trend for Euro bulls. At 5:00 AM ET tomorrow we get both the German and Euro Area ZEW Survey and that could be a key driver. Wednesday brings Q2 GDP numbers and that can similarly be key, although it’s lagging so perhaps not as large of an argument as the Tuesday outlay. And then on Friday we get inflation data out of Europe, and this will likely bring a strong bearing on the matter as it’ll speak to ECB rate hike odds for the next meeting in September. The expectation at this point is for another core inflation read at 5.5%, but if this comes out lower than expected this removes a bit of pressure from the bank and given the drawdown in data elsewhere, could make for a compelling case for the ECB to pause rate hikes at that next meeting, or at the very least to skip a hike in September.
From the four-hour chart below we can see that this morning’s break emanating from a descending triangle formation with that 1.0943 level in the equation as the top of support.
EUR/USD Four-Hour Price Chart

Chart prepared by James Stanley, EUR/USD on Tradingview
EUR/USD Longer-Term
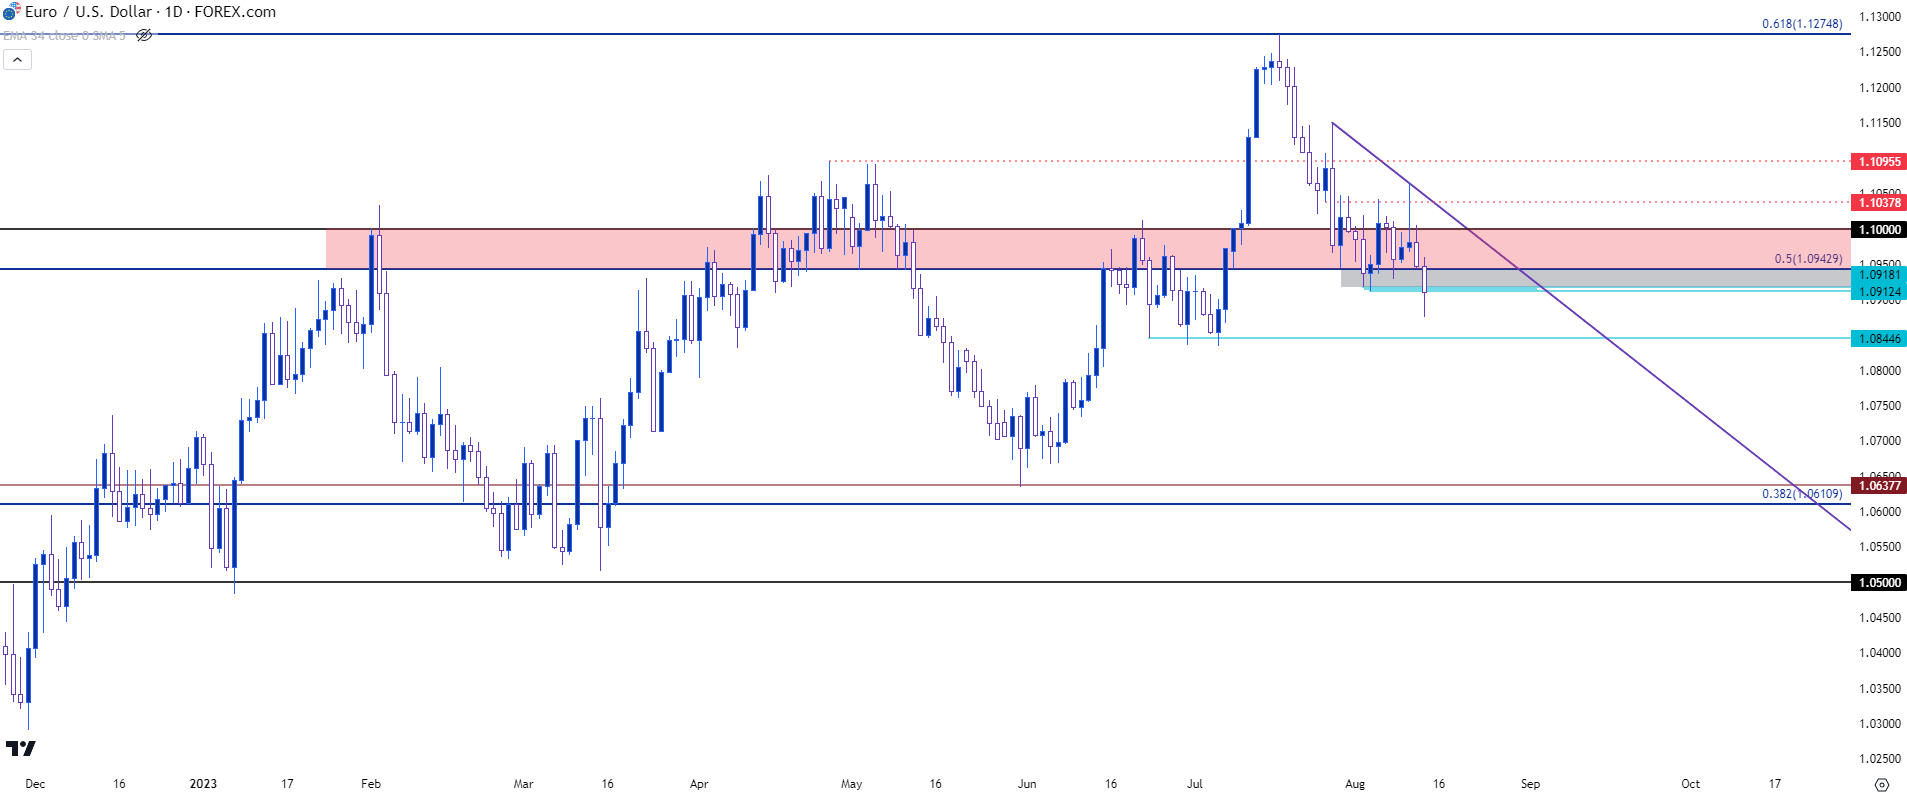
Taking a step back to the daily chart and some valuable context can be seen. EUR/USD has spent most of the year in varying states of mean reversion. The resistance hit at 1.1275 in July was an attempt to breakout from that pattern, but bulls failed to hold the move, which has allowed price to push back into the prior range.
Of note, however, was the resistance that was in-play before that breakout, which had held the highs through the first six months of the year while eliciting a couple of strong responses from bears. This does get messy though, since there was so much going on in that spot for so long and this complicates matters if tracking short-term resistance as there’s a few different ways that can play out while still retaining a bearish tilt.
Most aggressive would be a hold in the 1.0912-1.0943 zone, as this would be a clear indication from bears that they’re willing offer resistance at a lower-high without allowing for the pullback to run for much longer, which would keep the door open for continued breakdown potential. A little higher, a show from sellers inside of 1.1000 could similarly be construed as a positive for bears as this would be evidence of sellers’ willingness to produce a lower-high inside of the 1.1000 psychological level. Above that, however, matters get a bit more complicated. The bearish trendline is confluent with the 1.1038 level for tomorrow’s daily bar but if bulls push above that, it will start to look like failure from bears. The window wouldn’t be closed, however, as 1.1096 remains a spot of interest.
EUR/USD Daily Price Chart

Chart prepared by James Stanley, EUR/USD on Tradingview
EUR/USD Big Picture
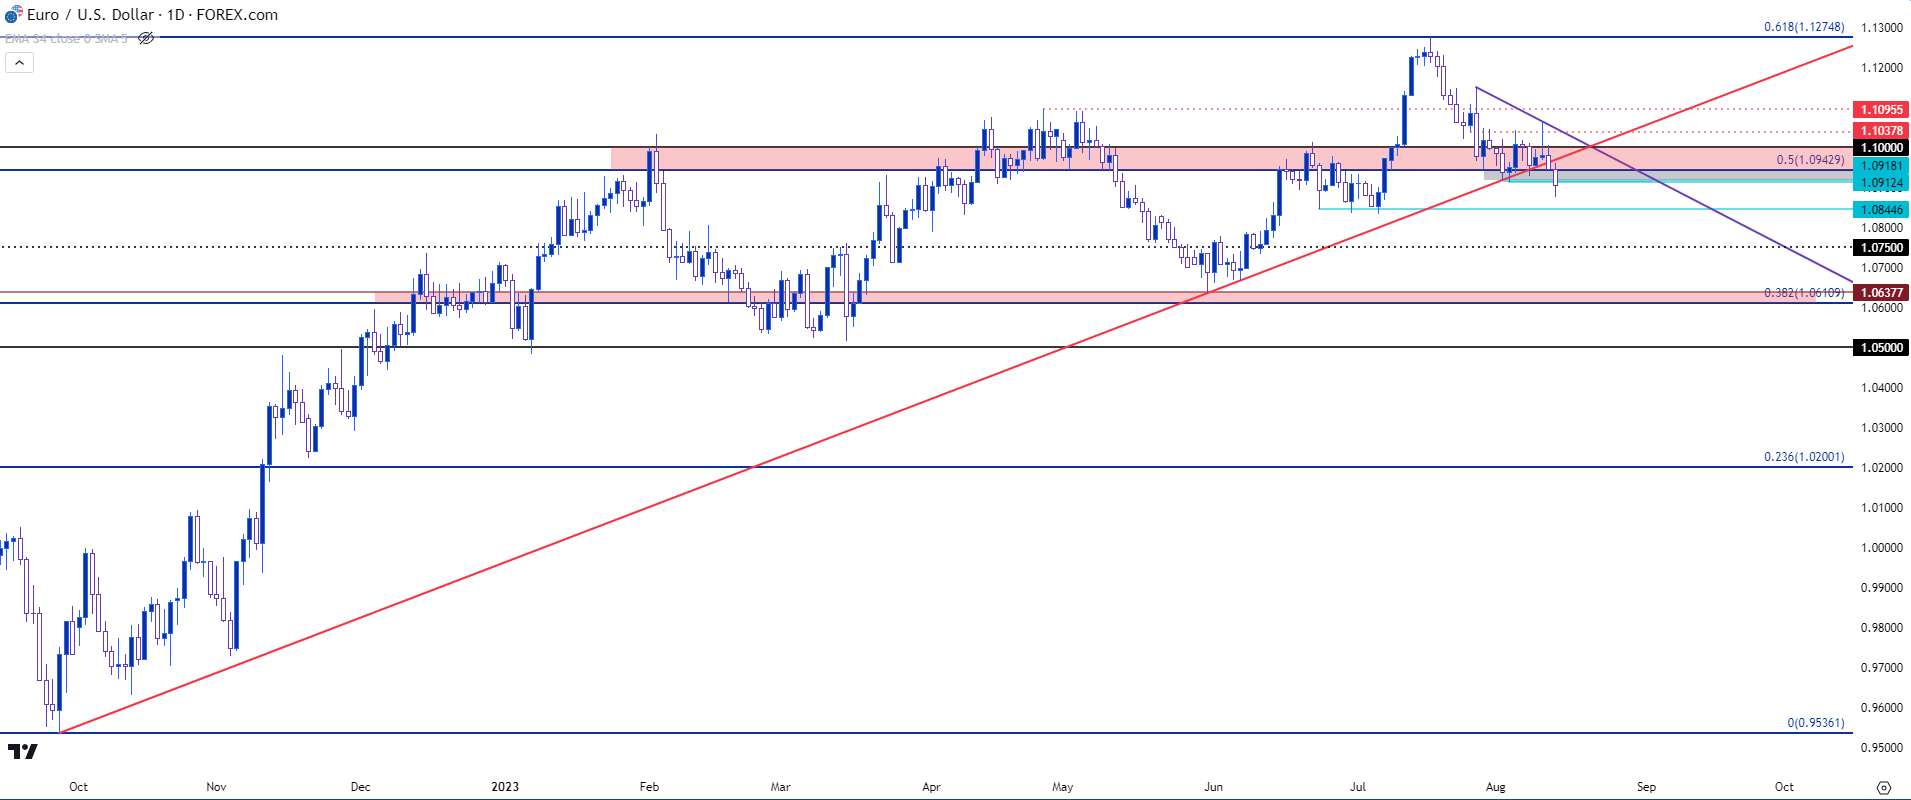
Taking a step back to the weekly chart and there’s another item of interest, as we’re now starting to see bears make a push below a longer-term trendline. This can be found by connecting lows from last September and this May, the projection of which started to come into play in early-August, around the same time that 1.0943 was getting tested as support. That trendline held the lows last Tuesday but finally started to give way on Friday, just as the US Dollar breakout was taking hold at a resistance trendline that makes up a falling wedge formation.
This puts bears in a position to push for a fresh trend and the data due over the coming days will likely play a role here. From the below daily chart, the next item of interest for support is around the 1.0845 swing that was in-play in June. A hold of support there would highlight a fresh lower-low along with potential for a support bounce into a lower-high.
If sellers can take out 1.0845 the next major spot of support would be around the 1.0611-1.0638 zone. There’s quite a bit of distance between those two spots however, so I’m also going to add in a potential spot of support around the 1.0750 psychological level, which has been traded at quite a bit this year, but this could function as somewhat of a mid-point between those two more pertinent zones of 1.0845 and 1.0611-1.0638.
EUR/USD Daily Price Chart

Chart prepared by James Stanley, EUR/USD on Tradingview
US Dollar
The Euro makes up a whopping 57.6% of the DXY basket so when examining longer-term trend potential in EUR/USD, the dynamics of DXY could be notable.
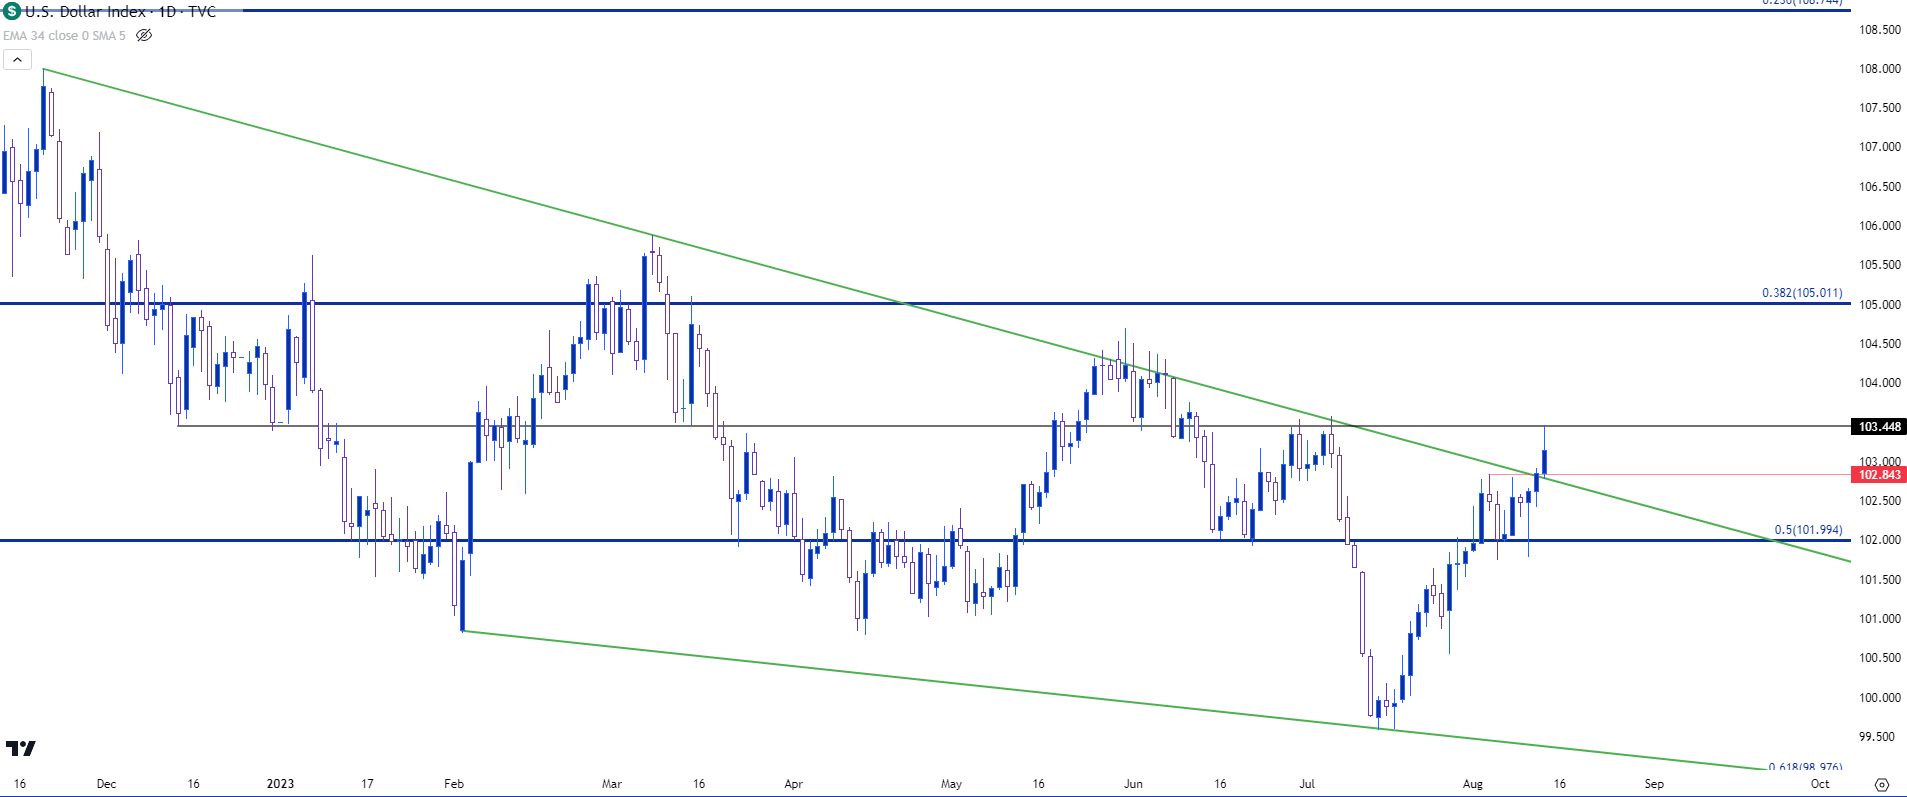
And just as we’re seeing that longer-term trendline traded through in EUR/USD, there’s a similar mirror image theme taking place in DXY as the currency tests above the resistance side of a falling wedge pattern. I looked into this last week just after the response to CPI, which seemed to be a big show from bulls despite the miss on both headline and core CPI reads.
The trendline atop that formation has been a real challenge for USD bulls so far this year, as there were multiple failed attempts to breakthrough. There was a two-week period in May and June when this trendline held more than 10 days of resistance without a single daily close above. And then when it came back into the picture in July, it was a brief test before sellers pounced and drove a fresh breakout to a yearly low in DXY. But – bears could not continue the move and price has snapped back over the past month, leading to a breakout from the formation.
At this stage, resistance has held in DXY at the 103.45 level and this keeps an open door for bulls to continue topside trends, but just as we had looked at with the breakdown in July, the big test here is whether buyers come into hold the move by showing higher-low support. Given the chasm of resistance from around 102.82-103.00, there’s an ideal area for that to show.
US Dollar - DXY Daily Price Chart (indicative only, not available on Forex.com platforms)

Chart prepared by James Stanley; data derived from Tradingview
--- written by James Stanley, Senior Strategist


