Euro, EUR/USD Talking Points:
- It was a big month of July for the Euro, EUR/USD in particular as the pair finally put in a breakout beyond the 1.1100 level that bulls were unable to test through in the first half of 2023.
- That breakout was fueled by US CPI in the middle of July, but it could not continue. What started as a pullback gained more steam last week around the European Central Bank rate decision.
- The monthly EUR/USD chart is now showing a false breakout as bulls were unable to hold price above prior resistance, but shorter-term, support has held at a key spot which can keep the bullish trend in order on the daily, along with the question mark as to whether they can push up to fresh highs.
- This is an archived webinar that hosted every Tuesday at 1PM ET. If you’d like to register, it’s free to do so from the following link: Click here to register.
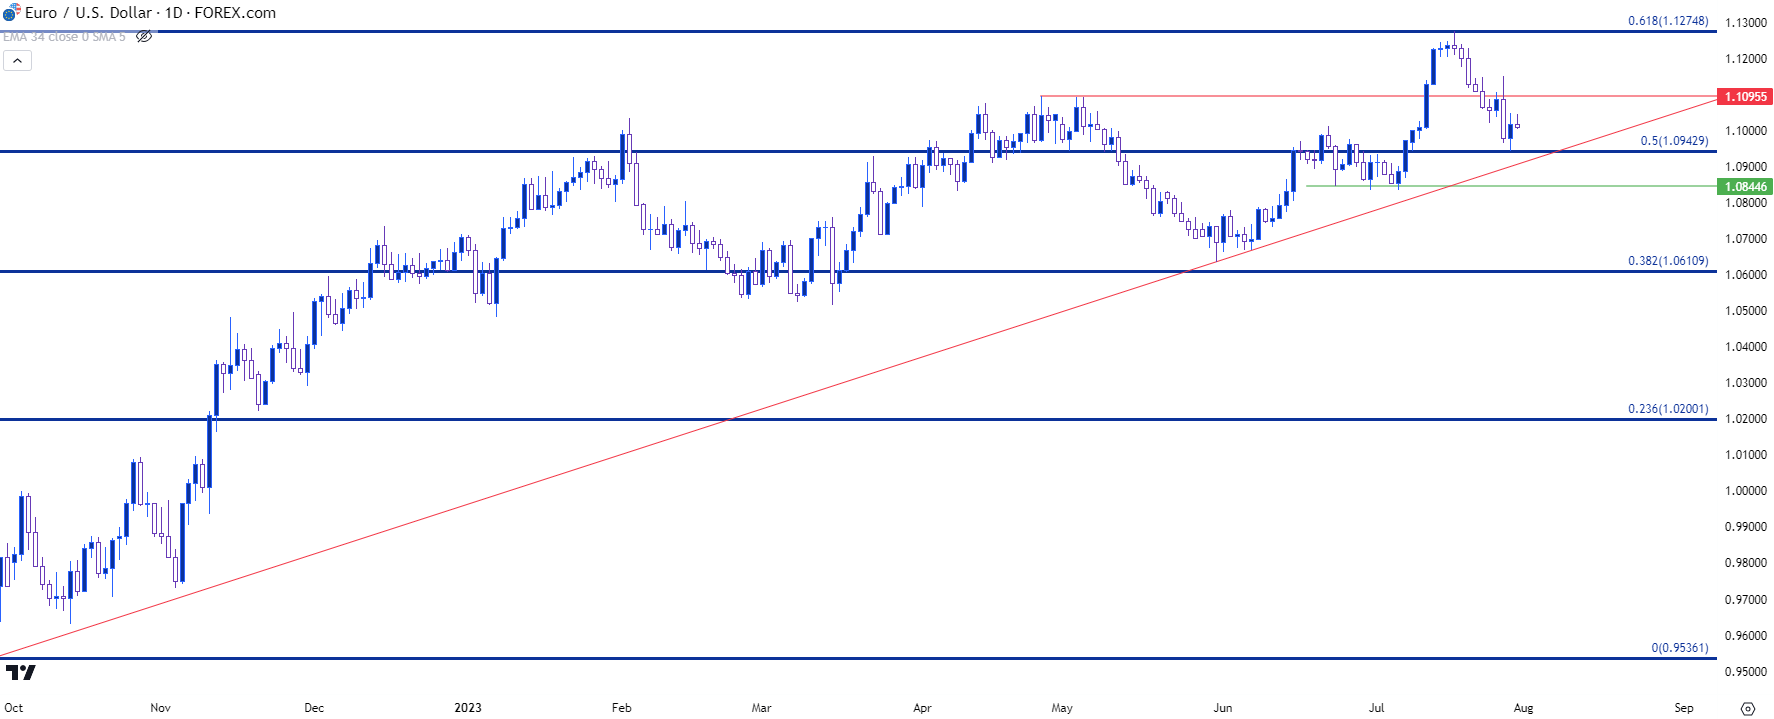
We’re in the closing hours of July trade and at this point, it’s been somewhat of a null month for EUR/USD as the monthly bar is showing little discernible trend.
It wasn’t like this all month, however, as a strong breakout developed in the middle of July after the release of CPI in the United States, which showed continued decline in both headline and core CPI. That led to a springboard breakout in EUR/USD as the US Dollar dropped below a major spot of support around the 101 handle.
EUR/USD continued to drive for another couple of days after that print, eventually finding resistance at a key Fibonacci level at 1.1275, which is the 61.8% Fibonacci retracement of the 2021-2022 major move. That price held the high into a massive week of both data and central bank activity, and as I discussed last week, worsening PMI reports out of Europe along with worrisome bank lending activity started to dim the lights on the bullish fundamental theme in the Euro.
This caught another shot-in-the-arm on Thursday morning, after the FOMC, as the European Central Bank started to sound more dovish which seems to be at least partly due to that recent data. And in between the ECB meeting and press conference last Thursday, we also received some optimistic US data in the form of durable goods and GDP.
Collectively, that helped to push the pullback even deeper as USD strength and Euro weakness showed. EUR/USD dropped all the way until the 1.0943 level started to come into play, and this is the 50% mark of that same Fibonacci retracement, and this would be a support test at prior resistance which could keep the door open for bullish continuation scenarios from the daily chart below.
EUR/USD Daily Price Chart
 Chart prepared by James Stanley, EUR/USD on Tradingview
EUR/USD Longer-Term
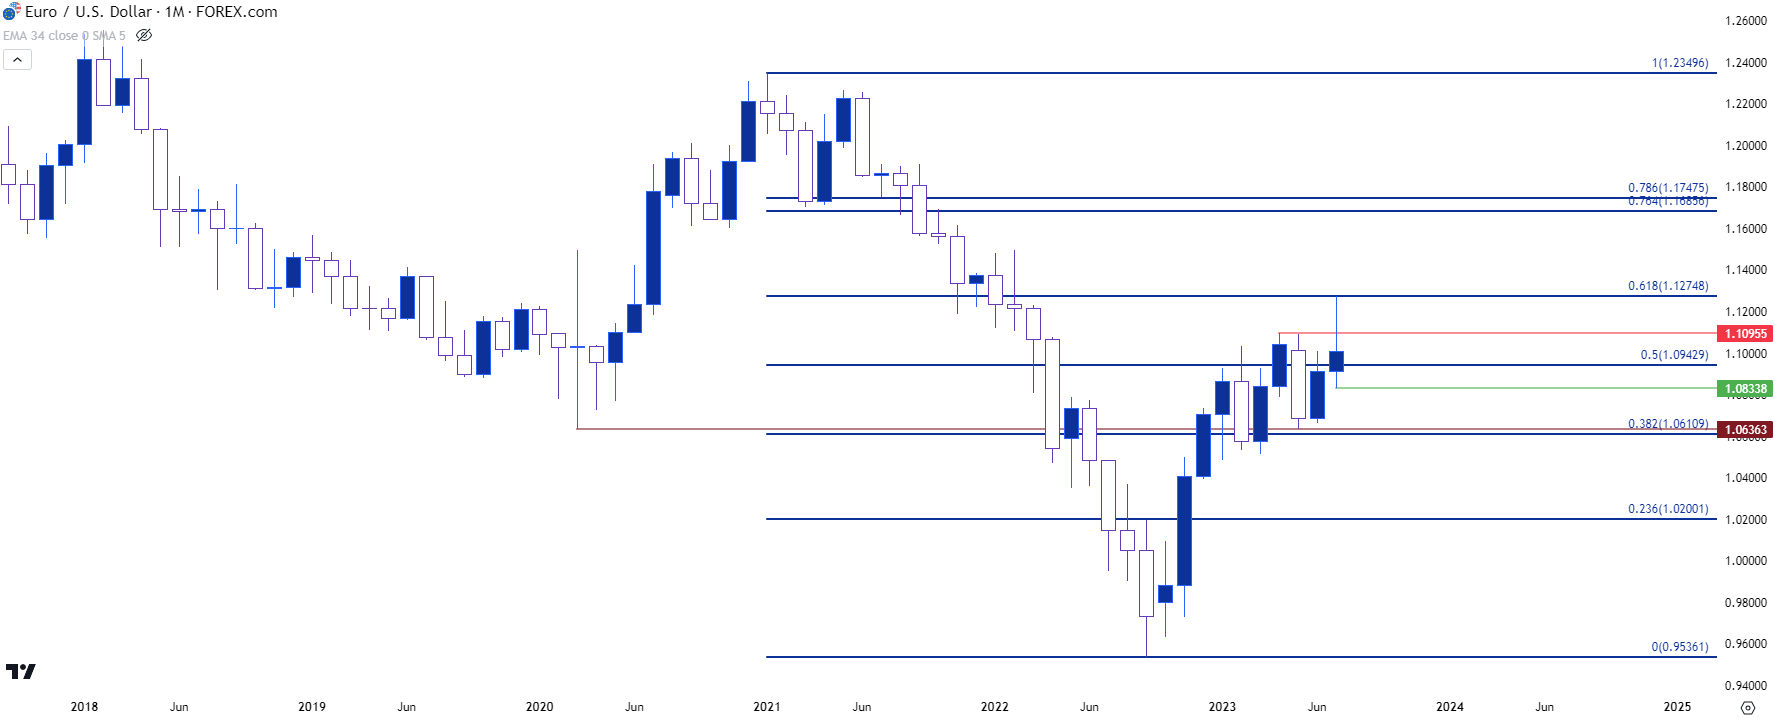
Longer-term, that bullish picture is quite a bit opaquer. What shows as a simple pullback from the daily chart looks more foreboding from the monthly chart given that failure from bulls to continue the breakout.
This could also provide some framework for reversal potential, and it puts emphasis on last month’s low at 1.0833, as a breach of that level would show lower lows to go along with that failure from bulls to defend the breakout. This would put longer-term focus towards the 1.0636 level, which was a swing low from the pandemic that came back into play to help hold the May monthly low. This is confluent with another Fibonacci level from that same study, with the 1.0611 level serving as the 38.2% retracement.
EUR/USD Monthly Price Chart
 Chart prepared by James Stanley, EUR/USD on Tradingview
EUR/USD Shorter-Term
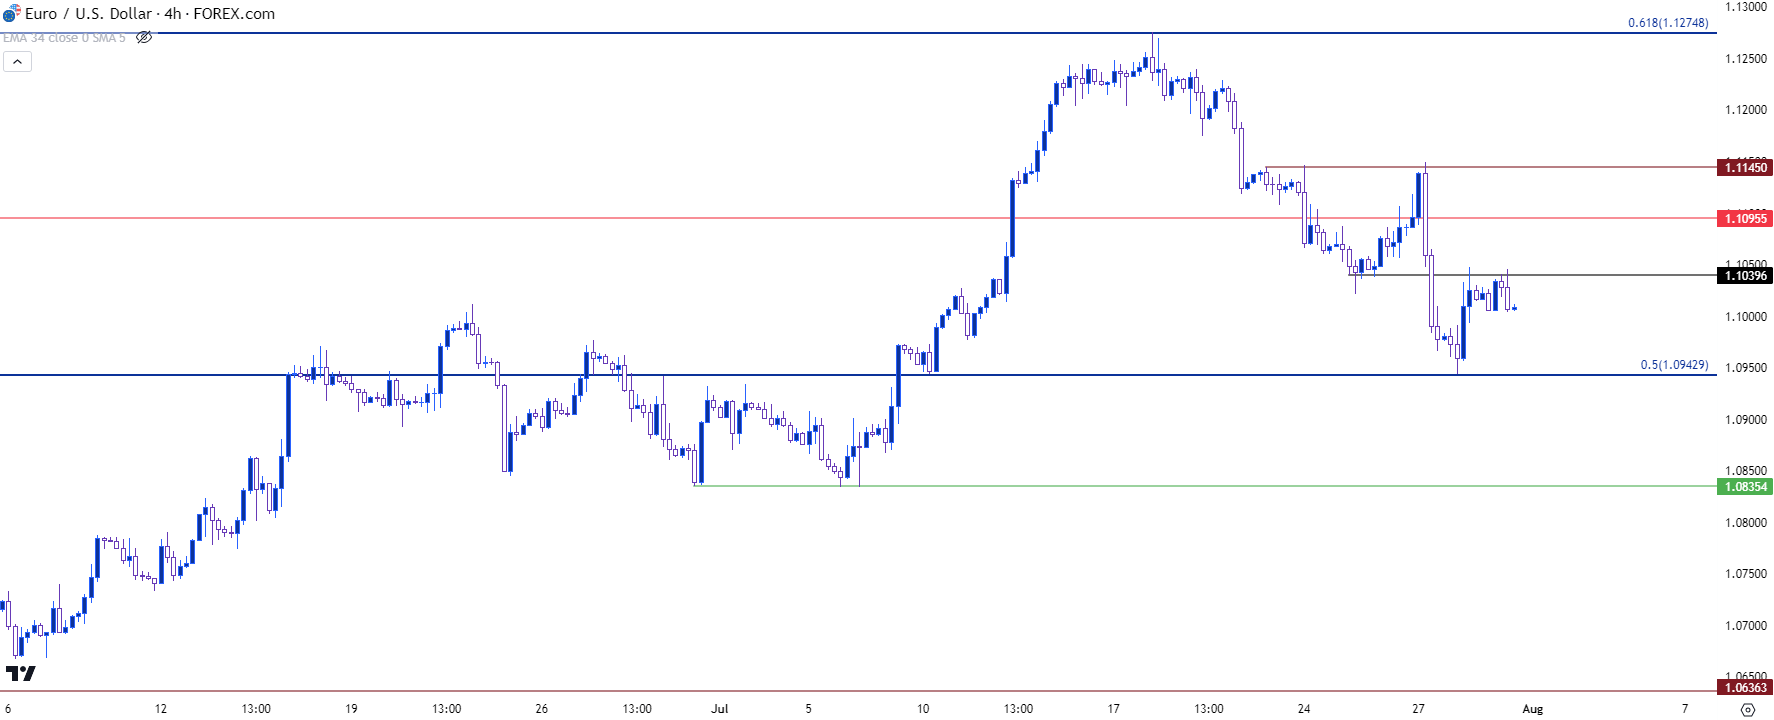
From the four hour chart, EUR/USD is continuing to show both lower-lows and lower-highs, which is at odds with the first chart looked at from the daily, which is showing pullback to a possible higher-low.
On the below chart there’s a bit more granularity but we can see that support bounce from 1.0943 leading into a push back above the 1.1000 handle. But, at this point, that’s been a hold at a lower-high which can keep short-term bears in order.
Taking a step back on the matter, it’s the price at 1.1145 that seems important for bulls in the early portion of this week. It was as wing that held the highs over a few different tests, notably last Thursday morning’s highs as we had both the ECB and US data creating commotion.
If bulls can take that out, the short-term sequence of lower-lows and lower-highs would be broken, and the bullish trend from the daily chart would then start to take on more attraction.
However, if bears can hold resistance at 1.1096, or perhaps even deeper around the 1.1040 level that’s been in-play a couple of times this morning, the door remains open for a re-test of the lows at 1.0943, and the next major support level below that is the 1.0835 level looked at on the weekly chart above. If sellers can take that level out – then the longer-term bearish reversal scenario will start to take on more attraction.
EUR/USD Four-Hour Price Chart
 Chart prepared by James Stanley, EUR/USD on Tradingview
--- written by James Stanley, Senior Strategist


