Weekly Technical Trade Levels on USD Majors, Commodities & Stocks
- Technical setups we're tracking into the weekly open
- Next Weekly Strategy Webinar: Monday, June 5 at 8:30am EST
- Review the latest Weekly Strategy Webinars on my YouTube playlist.
In this webinar we take an in-depth look at the technical trade levels for US Dollar (DXY), Euro (EUR/USD), Japanese Yen (USD/JPY), Canadian Dollar (USD/CAD), Gold (XAU/USD), Silver (XAG/USD), Crude Oil (WTI), S&P 500 (SPX500), Nasdaq (NDX), Dow Jones Industrial Average (DJI) GBP/JPY and Bitcoin (BTC/USD). These are the technical levels that matter this week.
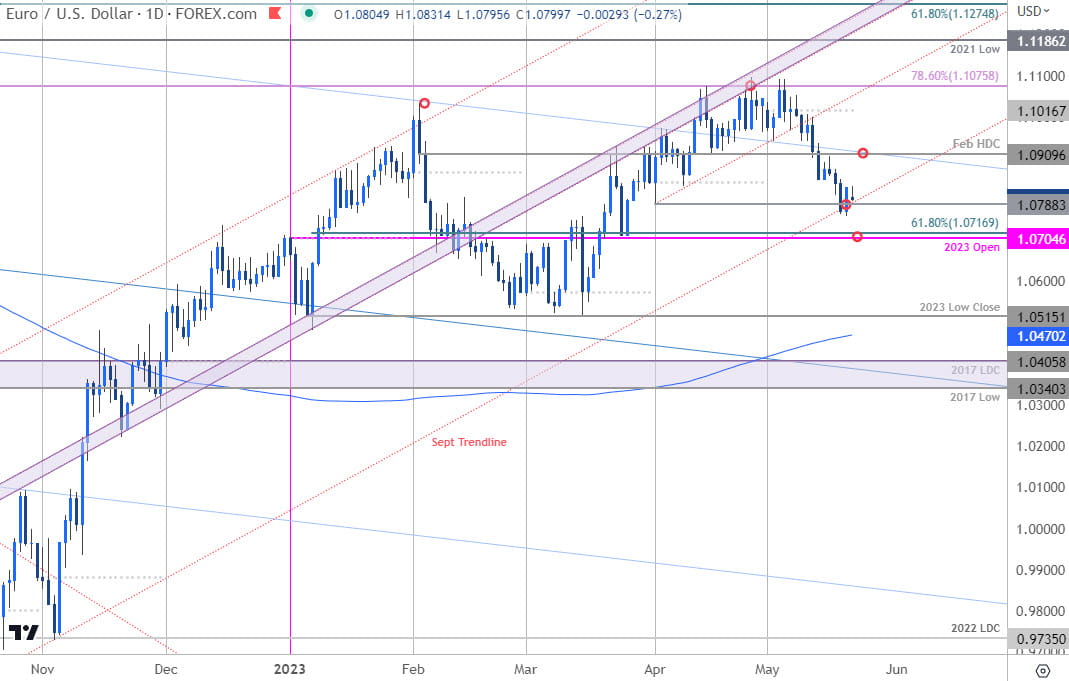
Euro Price Chart – EUR/USD Daily

Chart Prepared by Michael Boutros, Sr. Technical Strategist; EUR/USD on TradingView
Euro plunged into confluent support last week at the September trendline / April lows around 1.0788- looking for possible inflection here with a break below key support at 1.0704/17 needed to suggest a larger trend reversal is underway towards the yearly lows. Resistance now at 1.0909 backed by the monthly open at 1.1016 and 1.1075. Review my latest Euro technical forecast for a closer look at the longer-term technical trade levels.
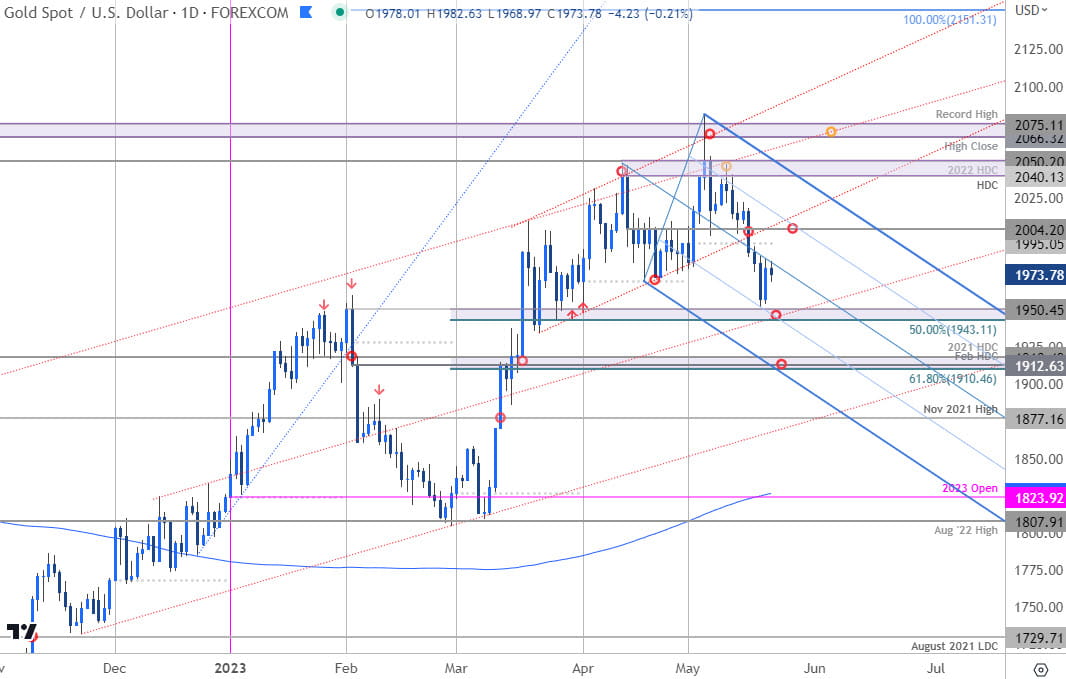
Gold Price Chart – XAU/USD Daily

Chart Prepared by Michael Boutros, Sr. Technical Strategist; XAU/USD on TradingView
Gold has plunged more than 6.2% off the highs with a break of the monthly opening-range faltering just ahead of the April lows. Initial resistance is eyed along the median-line backed by the May open at 1995 and 2004- rallies should be limited to this threshold IF price is heading lower.
The focus is on a key support at 1943/52- risk for exhaustion / price inflection into this zone. A close below would be needed to mark resumption of the monthly downtrend towards the next major support zone at 1910/18. Review my latest Gold Short-term Price Outlook for a closer look at the near-term XAU/USD technical trade levels.
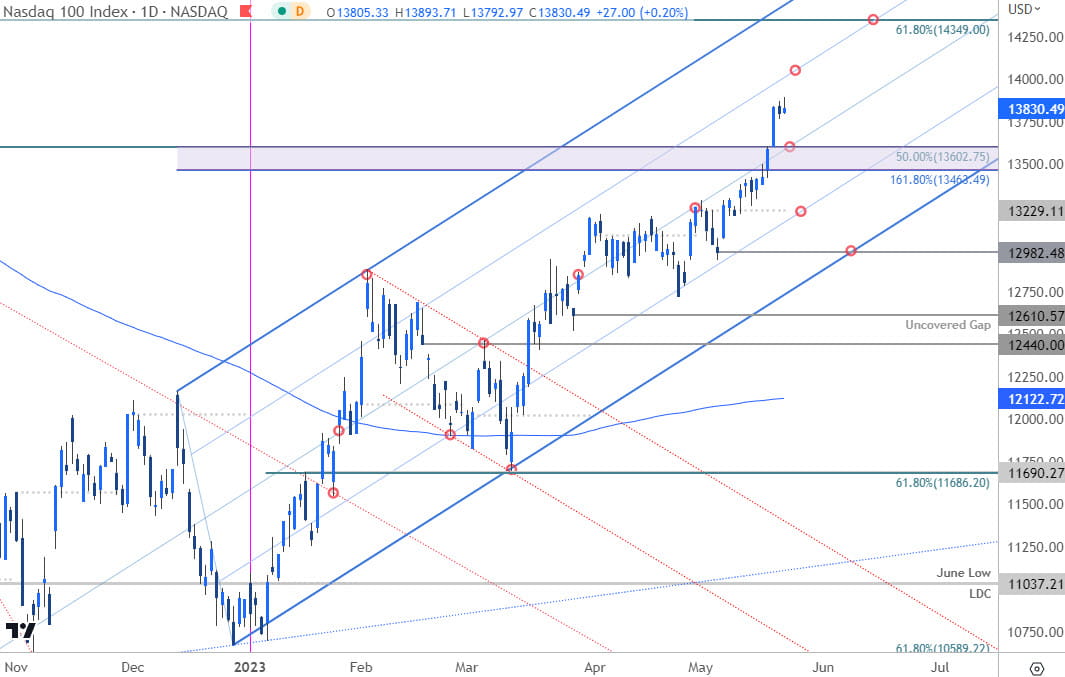
Nasdaq Price Chart – NDX Daily

Chart Prepared by Michael Boutros, Sr. Technical Strategist; Nasdaq on TradingView
Nasdaq continues to outperform the major indices with NDX holding near twelve-month highs. The breakout above 13463/602 keeps the focus higher while above with the next major resistance objectives eyed along the 75% parallel (currently ~14000) and the 61.8% Fibonacci retracement of the 2021 decline at 14849. A pivot back below this key zone would threaten a test of the monthly open at 13229 with broader bullish invalidation raised to the uncovered gap at 12982. Review my latest S&P 500, Nasdaq, Dow Technical Forecast for a closer look at the longer-term technical trade levels on the major indices.
--- Written by Michael Boutros, Sr Technical Strategist with FOREX.com
Follow Michael on Twitter @MBForex


